Bank of America 2004 Annual Report Download - page 47
Download and view the complete annual report
Please find page 47 of the 2004 Bank of America annual report below. You can navigate through the pages in the report by either clicking on the pages listed below, or by using the keyword search tool below to find specific information within the annual report.-
 1
1 -
2
-
3
-
4
-
5
-
6
-
7
-
8
-
9
-
10
-
11
-
12
-
13
-
14
-
15
-
16
-
17
-
18
-
19
-
20
-
21
-
22
-
23
-
24
-
25
-
26
-
27
-
28
-
29
-
30
-
31
-
32
-
33
-
34
-
35
-
36
-
 37
37 -
 38
38 -
 39
39 -
 40
40 -
 41
41 -
 42
42 -
 43
43 -
 44
44 -
 45
45 -
 46
46 -
 47
47 -
 48
48 -
 49
49 -
 50
50 -
 51
51 -
 52
52 -
 53
53 -
 54
54 -
 55
55 -
 56
56 -
 57
57 -
58
-
59
-
60
-
61
-
62
-
63
-
64
-
65
-
66
-
67
-
68
-
69
-
70
-
71
-
72
-
73
-
74
-
75
-
76
-
77
-
78
-
79
-
80
-
81
-
82
-
83
-
84
-
85
-
86
-
87
-
88
-
89
-
90
-
91
-
92
-
93
-
94
-
95
-
96
-
97
-
98
-
99
-
100
-
101
-
102
-
103
-
104
-
105
-
106
-
107
-
108
-
109
-
110
-
111
-
112
-
113
-
114
-
115
-
116
-
117
-
118
-
119
-
120
-
121
-
122
-
123
-
124
-
125
-
126
-
127
-
128
-
129
-
130
-
131
-
132
-
133
-
134
-
135
-
136
-
137
-
138
-
139
-
140
-
141
-
142
-
143
-
144
-
145
-
146
-
147
-
148
-
149
-
150
-
151
-
152
-
153
-
154
 |
 |

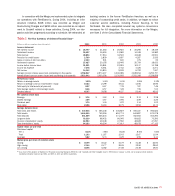
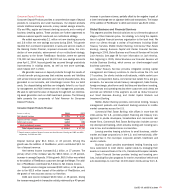
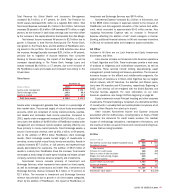
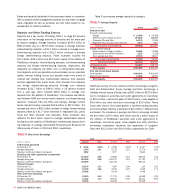
Global Business and Financial Services
(Dollars in millions) 2004 2003
Net interest income (fully taxable-equivalent basis) $ 4,593 $ 3,118
Noninterest income 2,129 1,399
Total revenue 6,722 4,517
Provision for credit losses (241) 458
Noninterest expense 2,476 1,797
Income before income taxes 4,487 2,262
Income tax expense 1,654 791
Net income $ 2,833 $ 1,471
Shareholder value added $ 884 $ 846
Net interest yield (fully taxable-equivalent basis) 3.40% 3.19%
Return on average equity 15.34 25.01
Efficiency ratio (fully taxable-equivalent basis) 36.84 39.75
Average:
Total loans and leases $ 129,671 $ 93,378
Total assets 154,521 103,786
Total deposits 53,088 31,461
Common equity/Allocated equity 18,473 5,882
Year end:
Total loans and leases 145,072 96,168
Total assets 178,093 107,791
Total deposits 61,395 37,882
Total Revenue for Global Business and Financial Services increased
$2.2 billion, or 49 percent, in 2004. The addition of FleetBoston
accounted for $1.7 billion of the increase. The Provision for Credit
Losses decreased $699 million, to a negative $241 million.
Noninterest Expense increased $679 million to $2.5 billion. Net
Income rose $1.4 billion, or 93 percent, including the $824 million
impact of the Merger. SVA increased $38 million, or four percent. This
segment’s capital allocation increased due to Goodwill as a result of
the Merger which was offset by the increase in Net Income.
Net Interest Income increased $1.5 billion, largely due to the
increase in commercial loan and lease, and deposit balances driven
by the addition of FleetBoston earning assets and the net results of
ALM activities. Net Interest Income was positively impacted by the
$36.3 billion, or 39 percent, increase in average outstanding com-
mercial loans. Also contributing to the improvement in Net Interest
Income was the $21.6 billion, or 69 percent, increase in average
commercial deposits. Impacting these increases was the $29.3 bil-
lion effect on average Loans and Leases, and the $17.6 billion effect
on average Deposits related to the addition of FleetBoston.
During 2004, Noninterest Income increased $730 million, or 52
percent, to $2.1 billion. Included in the results was $601 million of
Noninterest Income related to FleetBoston. Overall, the increase was
driven by a $341 million increase in Other Noninterest Income to
$518 million, and a $261 million, or 36 percent, increase in Service
Charges to $988 million. Other Noninterest Income increased by $109
million due to higher income from community development tax credit
real estate investments. The increase in Service Charges was primarily
driven by the Merger. Also affecting the increase in Noninterest Income
was the $43 million increase in Trading Account Profits.
The Provision for Credit Losses declined $699 million to a neg-
ative $241 million. The decrease was partially driven by a $264 mil-
lion, or 59 percent, decrease in net charge-offs. Additionally, notable
improvement in credit quality has been achieved in a number of our
major businesses. For more information, see Credit Risk
Management beginning on page 58.
Noninterest Expense increased $679 million, or 38 percent, due
to the $644 million addition of FleetBoston. Driving the increase was a
$300 million increase in total Personnel Expense and a $260 million
increase in Data Processing Expense.
Global Capital Markets and Investment Banking
Our strategy is to align our resources with sectors where we can
deliver value-added financial advisory solutions to our issuer and
investor clients. This segment provides a broad range of financial
services to domestic and international corporations, financial institu-
tions, and government entities. Clients are supported through offices
in 35 countries that are divided into four distinct geographic regions:
U.S. and Canada; Asia; Europe, Middle East and Africa; and Mexico.
Products and services provided include loan originations, mergers
and acquisitions advisory, debt and equity underwriting and trading,
cash management, derivatives, foreign exchange, leveraged finance,
structured finance and trade services.
This segment offers clients a comprehensive range of global
capabilities through the following three financial services:
Global Investment Banking, Global Credit Products and Global
Treasury Services.
Global Investment Banking is comprised of Corporate and
Investment Banking and Global Capital Markets. Global Investment
Banking underwrites and makes markets in equity and equity-linked
securities, high-grade and high-yield corporate debt securities, com-
mercial paper, and mortgage-backed and asset-backed securities. We
also provide debt and equity securities research, loan syndications,
mergers and acquisitions advisory services and private placements.
Further, we provide risk management solutions for customers using
interest rate, equity, credit and commodity derivatives, foreign
exchange, fixed income and mortgage-related products. In support of
these activities, the businesses may take positions in these products
and participate in market-making activities. The Global Investment
Banking business is a primary dealer in the U.S. and in several inter-
national locations.
Global Credit Products provides credit and lending services for
our corporate clients and institutional investors. Global Credit
Products is also responsible for actively managing loan and counter-
party risk in our large corporate portfolio using available risk mitigation
techniques, including credit default swaps.
Global Treasury Services provides the technology, strategies and
integrated solutions to help financial institutions, government agencies
and corporate clients manage their cash flows.
46 BANK OF AMERICA 2004