Bank of America 2004 Annual Report Download - page 149
Download and view the complete annual report
Please find page 149 of the 2004 Bank of America annual report below. You can navigate through the pages in the report by either clicking on the pages listed below, or by using the keyword search tool below to find specific information within the annual report.-
 1
1 -
2
-
3
-
4
-
5
-
6
-
7
-
8
-
9
-
10
-
11
-
12
-
13
-
14
-
15
-
16
-
17
-
18
-
19
-
20
-
21
-
22
-
23
-
24
-
25
-
26
-
27
-
28
-
29
-
30
-
31
-
32
-
33
-
34
-
35
-
36
-
37
-
38
-
39
-
40
-
41
-
42
-
43
-
44
-
45
-
46
-
47
-
48
-
49
-
50
-
51
-
52
-
53
-
54
-
55
-
56
-
57
-
58
-
59
-
60
-
61
-
62
-
63
-
64
-
65
-
66
-
67
-
68
-
69
-
70
-
71
-
72
-
73
-
74
-
75
-
76
-
77
-
78
-
79
-
80
-
81
-
82
-
83
-
84
-
85
-
86
-
87
-
88
-
89
-
90
-
91
-
92
-
93
-
94
-
95
-
96
-
97
-
98
-
99
-
100
-
101
-
102
-
103
-
104
-
105
-
106
-
107
-
108
-
109
-
110
-
111
-
112
-
113
-
114
-
115
-
116
-
117
-
118
-
119
-
120
-
121
-
122
-
123
-
124
-
125
-
126
-
127
-
128
-
129
-
130
-
131
-
132
-
133
-
134
-
135
-
136
-
137
-
138
-
 139
139 -
 140
140 -
 141
141 -
 142
142 -
 143
143 -
 144
144 -
 145
145 -
 146
146 -
 147
147 -
 148
148 -
 149
149 -
 150
150 -
 151
151 -
 152
152 -
 153
153 -
 154
154
 |
 |

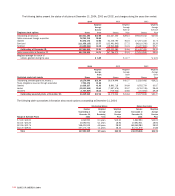
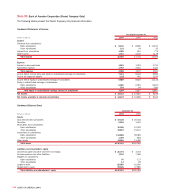
Note 20
Bank of America Corporation (Parent Company Only)
The following tables present the Parent Company Only financial information:
Condensed Statement of Income
Year Ended December 31
(Dollars in millions) 2004 2003 2002
Income
Dividends from subsidiaries:
Bank subsidiaries $ 8,100 $ 8,950 $ 11,100
Other subsidiaries 133 34 10
Interest from subsidiaries 1,085 610 775
Other income 1,351 2,140 1,138
Total income 10,669 11,734 13,023
Expense
Interest on borrowed funds 1,861 1,391 1,700
Noninterest expense 1,797 2,181 1,361
Total expense 3,658 3,572 3,061
Income before income taxes and equity in undistributed earnings of subsidiaries 7,011 8,162 9,962
Income tax (expense) benefit (122) 461 1,154
Income before equity in undistributed earnings of subsidiaries 6,889 8,623 11,116
Equity in undistributed earnings of subsidiaries:
Bank subsidiaries 6,680 2,093 (1,607)
Other subsidiaries 574 94 (260)
Total equity in undistributed earnings (losses) of subsidiaries 7,254 2,187 (1,867)
Net income $ 14,143 $ 10,810 $ 9,249
Net income available to common shareholders $ 14,127 $ 10,806 $ 9,244
Condensed Balance Sheet
December 31
(Dollars in millions) 2004 2003
Assets
Cash held at bank subsidiaries $ 47,138 $ 20,436
Securities 2,694 1,441
Receivables from subsidiaries:
Bank subsidiaries 10,546 10,042
Other subsidiaries 19,897 15,103
Investments in subsidiaries:
Bank subsidiaries 114,868 59,085
Other subsidiaries 1,499 818
Other assets 13,859 13,459
Total assets $ 210,501 $120,384
Liabilities and shareholders’ equity
Commercial paper and other short-term borrowings $ 20,774 $ 3,333
Accrued expenses and other liabilities 7,124 7,469
Payables to subsidiaries:
Bank subsidiaries 76 173
Other subsidiaries 13 29
Long-term debt 82,869 61,400
Shareholders’ equity 99,645 47,980
Total liabilities and shareholders’ equity $ 210,501 $120,384
148 BANK OF AMERICA 2004