Bank of America 2004 Annual Report Download - page 37
Download and view the complete annual report
Please find page 37 of the 2004 Bank of America annual report below. You can navigate through the pages in the report by either clicking on the pages listed below, or by using the keyword search tool below to find specific information within the annual report.-
 1
1 -
2
-
3
-
4
-
5
-
6
-
7
-
8
-
9
-
10
-
11
-
12
-
13
-
14
-
15
-
16
-
17
-
18
-
19
-
20
-
21
-
22
-
23
-
24
-
25
-
26
-
 27
27 -
 28
28 -
 29
29 -
 30
30 -
 31
31 -
 32
32 -
 33
33 -
 34
34 -
 35
35 -
 36
36 -
 37
37 -
 38
38 -
 39
39 -
 40
40 -
 41
41 -
 42
42 -
 43
43 -
 44
44 -
 45
45 -
 46
46 -
 47
47 -
48
-
49
-
50
-
51
-
52
-
53
-
54
-
55
-
56
-
57
-
58
-
59
-
60
-
61
-
62
-
63
-
64
-
65
-
66
-
67
-
68
-
69
-
70
-
71
-
72
-
73
-
74
-
75
-
76
-
77
-
78
-
79
-
80
-
81
-
82
-
83
-
84
-
85
-
86
-
87
-
88
-
89
-
90
-
91
-
92
-
93
-
94
-
95
-
96
-
97
-
98
-
99
-
100
-
101
-
102
-
103
-
104
-
105
-
106
-
107
-
108
-
109
-
110
-
111
-
112
-
113
-
114
-
115
-
116
-
117
-
118
-
119
-
120
-
121
-
122
-
123
-
124
-
125
-
126
-
127
-
128
-
129
-
130
-
131
-
132
-
133
-
134
-
135
-
136
-
137
-
138
-
139
-
140
-
141
-
142
-
143
-
144
-
145
-
146
-
147
-
148
-
149
-
150
-
151
-
152
-
153
-
154
 |
 |

36 BANK OF AMERICA 2004
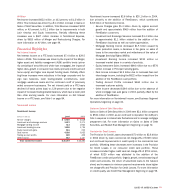
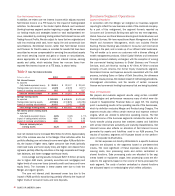
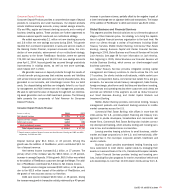
Noninterest Expense
Noninterest Expense
(Dollars in millions) 2004 2003
Personnel $ 13,473 $10,446
Occupancy 2,379 2,006
Equipment 1,214 1,052
Marketing 1,349 985
Professional fees 836 844
Amortization of intangibles 664 217
Data processing 1,325 1,104
Telecommunications 730 571
Other general operating 4,439 2,930
Merger and restructuring charges 618 –
Total noninterest expense $ 27,027 $20,155
Noninterest Expense increased $6.9 billion to $27.0 billion in 2004,
due primarily to the addition of FleetBoston, which contributed
$5.0 billion of Noninterest Expense.
•Personnel Expense increased $3.0 billion due to the $2.3 billion
impact of FleetBoston associates.
•Marketing Expense increased $364 million due to increased
advertising for card programs and increased advertising costs
in the Northeast.
•Amortization of Intangibles increased $447 million driven by the
amortization of intangible assets acquired in the Merger.
•Other General Operating Expense increased $1.5 billion related
to the $904 million impact of the addition of FleetBoston, $370
million of litigation expenses incurred during 2004 and the
$285 million related to the mutual fund settlement (net of a
$90 million reserve established in 2003). This net settlement
expense was divided equally between Global Capital Markets
and Investment Banking and Global Wealth and Investment
Management for business segment reporting purposes.
•Merger and Restructuring Charges, including an infrastructure
initiative, were $618 million in connection with the integration
of FleetBoston’s operations. For more information on Merger
and Restructuring Charges, see Note 2 of the Consolidated
Financial Statements.
For more information on Noninterest Expense, see Business
Segment Operations beginning on page 40.
Income Tax Expense
Income Tax Expense was $7.1 billion, reflecting an effective tax rate
of 33.4 percent, in 2004 compared to $5.1 billion and 31.8 percent,
respectively, in 2003. The difference in the effective tax rate between
years resulted primarily from the application of purchase accounting
to certain leveraged leases acquired in the Merger, an increase in
state tax expense generally related to higher tax rates in the
Northeast and the reduction in 2003 of Income Tax Expense result-
ing from a tax settlement with the IRS. For more information on
Income Tax Expense, see Note 17 of the Consolidated Financial
Statements.
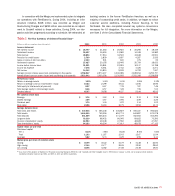
Assets
Average Loans and Leases increased $116.5 billion, or 33 percent,
in 2004. Of this increase, $88.9 billion related to the addition of
FleetBoston. The remaining increase was driven by growth in our res-
idential mortgage and consumer credit card portfolios of $16.1 billion
and $10.1 billion, respectively. Average Available-for-sale (AFS)
Securities increased $79.7 billion, or 114 percent, as a result of
investing excess cash from deposit growth and repositioning our ALM
portfolio. Additionally, average trading-related assets increased
$55.0 billion as we expanded our trading book to accommodate the
needs of our clients. For more information, see Table
I
on page 84.
Liabilities and Shareholders’ Equity
Average core deposits increased $130.7 billion, or 36 percent. Of
this increase, $95.6 billion is attributable to the addition of
FleetBoston. The remaining increase was attributable to organic
growth which resulted from our continued improvements in customer
satisfaction, new product offerings and our account growth efforts. At
December 31, 2004, our Tier 1 Capital ratio was 8.10 percent, com-
pared to a ratio of 7.85 percent at December 31, 2003. For more
information, see Table
I
on page 84 and Note 14 of the Consolidated
Financial Statements.
FleetBoston Merger
Pursuant to the Agreement and Plan of Merger, dated October 27,
2003, between the Corporation and FleetBoston (the Merger
Agreement), we acquired 100 percent of the outstanding stock of
FleetBoston on April 1, 2004. The Merger created a banking institution
with leading market shares throughout the Northeast, Southeast,
Southwest and West regions of the United States. FleetBoston’s
results of operations were included in the Corporation’s results beginning
April 1, 2004.
As provided by the Merger Agreement, approximately 1.069 billion
shares of FleetBoston common stock were exchanged for approxi-
mately 1.187 billion shares of the Corporation’s common stock, as
adjusted for the stock split. At the date of the Merger, this repre-
sented approximately 29 percent of the Corporation’s outstanding
common stock. FleetBoston shareholders also received cash of $4
million in lieu of any fractional shares of the Corporation’s common
stock that would have otherwise been issued on April 1, 2004.
Holders of FleetBoston preferred stock received 1.1 million shares of
the Corporation’s preferred stock. The purchase price was adjusted
to reflect the effect of the 15.7 million shares of FleetBoston common
stock that we already owned.