Bank of America 2004 Annual Report Download - page 48
Download and view the complete annual report
Please find page 48 of the 2004 Bank of America annual report below. You can navigate through the pages in the report by either clicking on the pages listed below, or by using the keyword search tool below to find specific information within the annual report.-
 1
1 -
2
-
3
-
4
-
5
-
6
-
7
-
8
-
9
-
10
-
11
-
12
-
13
-
14
-
15
-
16
-
17
-
18
-
19
-
20
-
21
-
22
-
23
-
24
-
25
-
26
-
27
-
28
-
29
-
30
-
31
-
32
-
33
-
34
-
35
-
36
-
37
-
 38
38 -
 39
39 -
 40
40 -
 41
41 -
 42
42 -
 43
43 -
 44
44 -
 45
45 -
 46
46 -
 47
47 -
 48
48 -
 49
49 -
 50
50 -
 51
51 -
 52
52 -
 53
53 -
 54
54 -
 55
55 -
 56
56 -
 57
57 -
 58
58 -
59
-
60
-
61
-
62
-
63
-
64
-
65
-
66
-
67
-
68
-
69
-
70
-
71
-
72
-
73
-
74
-
75
-
76
-
77
-
78
-
79
-
80
-
81
-
82
-
83
-
84
-
85
-
86
-
87
-
88
-
89
-
90
-
91
-
92
-
93
-
94
-
95
-
96
-
97
-
98
-
99
-
100
-
101
-
102
-
103
-
104
-
105
-
106
-
107
-
108
-
109
-
110
-
111
-
112
-
113
-
114
-
115
-
116
-
117
-
118
-
119
-
120
-
121
-
122
-
123
-
124
-
125
-
126
-
127
-
128
-
129
-
130
-
131
-
132
-
133
-
134
-
135
-
136
-
137
-
138
-
139
-
140
-
141
-
142
-
143
-
144
-
145
-
146
-
147
-
148
-
149
-
150
-
151
-
152
-
153
-
154
 |
 |

BANK OF AMERICA 2004 47
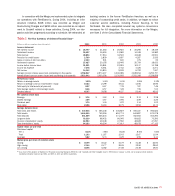
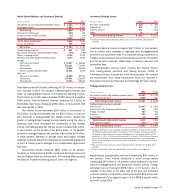
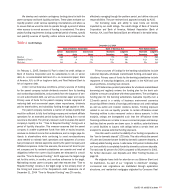
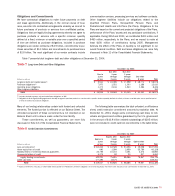
Global Capital Markets and Investment Banking
(Dollars in millions) 2004 2003
Net interest income (fully taxable-equivalent basis) $ 4,122 $ 4,289
Noninterest income 4,927 4,045
Total revenue 9,049 8,334
Provision for credit losses (459) 303
Losses on sales of debt securities (10) (14)
Noninterest expense 6,556 5,327
Income before income taxes 2,942 2,690
Income tax expense 992 896
Net income $ 1,950 $ 1,794
Shareholder value added $ 891 $ 893
Net interest yield (fully taxable-equivalent basis) 1.49% 1.86%
Return on average equity 19.46 21.35
Efficiency ratio (fully taxable-equivalent basis) 72.45 63.91
Average:
Total loans and leases $ 34,237 $ 36,640
Total assets 323,101 272,942
Total deposits 76,884 66,095
Common equity/Allocated equity 10,021 8,404
Year end:
Total loans and leases 33,899 29,104
Total assets 307,451 225,839
Total deposits 79,376 58,504
Total Revenue was $9.0 billion, reflecting a $715 million, or nine per-
cent, increase in 2004. The increase in Market-based revenues was
driven by trading-related revenue and Investment Banking Income.
The Provision for Credit Losses decreased $762 million to a negative
$459 million. Total Noninterest Expense increased $1.2 billion to
$6.6 billion. Net Income increased $156 million, or nine percent. SVA
was relatively flat in 2004.
Net Interest Income decreased $167 million, or four percent, to
$4.1 billion. Driving this decrease was the $200 million, or nine per-
cent, decrease in trading-related Net Interest Income. Despite the
growth in trading-related average earning assets during the year, a
flattening yield curve decreased the contribution to Net Interest
Income. Nontrading-related Net Interest Income increased $33 million,
or two percent, as the benefit of the $10.8 billion, or 16 percent,
increase in average Deposits was partially offset by the $2.4 billion,
or seven percent, decrease in average Loans and Leases. Average
Deposits increased despite the withdrawal of compensating balances
by the U.S. Treasury due to changes in our compensation agreements
with them.
Noninterest Income increased $882 million, or 22 percent.
Increases in Trading Account Profits, Investment Banking Income and
Service Charges drove the improvement. The following table presents
the detail of Investment Banking Income within the segment.
Investment Banking Income
(Dollars in millions) 2004 2003
Securities underwriting $ 920 $ 962
Syndications 521 407
Advisory services 310 229
Other 32 38
Total Investment Banking Income(1) $ 1,783 $ 1,636
(1) Investment Banking Income recorded in other business units in 2004 and 2003 was $103
and $100.
Investment Banking Income increased $147 million, or nine percent,
due to market share increases in high-yield debt, mortgage-backed
securities and convertible debt. The continued strong momentum in
mergers and acquisitions, and syndicated loans drove the 35 percent
and 28 percent increases, respectively, in advisory services and
syndication fees.
Trading-related revenue, which includes Net Interest Income
from trading-related positions and Trading Account Profits in
Noninterest Income, is presented in the following table. Not included
are commissions from equity transactions which are recorded in
Noninterest Income as Investment and Brokerage Services Income.
Trading-related Revenue
(Dollars in millions) 2004 2003
Net interest income (fully taxable-equivalent basis) $ 2,039 $ 2,239
Trading account profits(1) 1,028 587
Total trading-related revenue(1) $ 3,067 $ 2,826
Trading-related revenue by product
Fixed income $ 1,547 $ 1,352
Interest rate (fully taxable-equivalent basis) 667 954
Foreign exchange 757 551
Equities(2) 195 344
Commodities 45 (45)
Market-based trading-related revenue 3,211 3,156
Credit portfolio hedges(3) (144) (330)
Total trading-related revenue(1) $ 3,067 $ 2,826
(1) Trading Account Profits for the Corporation were $869 and $409 for 2004 and 2003. In 2004,
the difference relates to the impact of the valuation of the Certificates, which was partially off-
set by gains in Global Wealth and Investment Management and Latin America of $86 and $72,
respectively. In 2003, the difference relates primarily to the impact of the Certificates. See page
44 for more information on the Certificates. Total trading-related revenue for the Corporation
was $2,908 and $2,648 for 2004 and 2003, and was impacted in a similar manner as Trading
Account Profits.
(2) Does not include commissions from equity transactions which were $666 and $648 in 2004
and 2003.
(3) Includes credit default swaps and related products used for credit risk management.
Market-based trading-related revenue increased by $55 million, or
two percent. Fixed income continued to show strong results
increasing $195 million, or 14 percent, driven by growth in our com-
mercial mortgage-backed and structured finance activity. Foreign
exchange revenue increased $206 million, or 37 percent, due to
volatility of the dollar in the latter half of the year and increased
customer activity. Commodities revenue increased $90 million due
to the absence of the negative impact of the SARS outbreak, which
occurred during 2003.