Bank of America 2004 Annual Report Download - page 138
Download and view the complete annual report
Please find page 138 of the 2004 Bank of America annual report below. You can navigate through the pages in the report by either clicking on the pages listed below, or by using the keyword search tool below to find specific information within the annual report.-
 1
1 -
2
-
3
-
4
-
5
-
6
-
7
-
8
-
9
-
10
-
11
-
12
-
13
-
14
-
15
-
16
-
17
-
18
-
19
-
20
-
21
-
22
-
23
-
24
-
25
-
26
-
27
-
28
-
29
-
30
-
31
-
32
-
33
-
34
-
35
-
36
-
37
-
38
-
39
-
40
-
41
-
42
-
43
-
44
-
45
-
46
-
47
-
48
-
49
-
50
-
51
-
52
-
53
-
54
-
55
-
56
-
57
-
58
-
59
-
60
-
61
-
62
-
63
-
64
-
65
-
66
-
67
-
68
-
69
-
70
-
71
-
72
-
73
-
74
-
75
-
76
-
77
-
78
-
79
-
80
-
81
-
82
-
83
-
84
-
85
-
86
-
87
-
88
-
89
-
90
-
91
-
92
-
93
-
94
-
95
-
96
-
97
-
98
-
99
-
100
-
101
-
102
-
103
-
104
-
105
-
106
-
107
-
108
-
109
-
110
-
111
-
112
-
113
-
114
-
115
-
116
-
117
-
118
-
119
-
120
-
121
-
122
-
123
-
124
-
125
-
126
-
127
-
 128
128 -
 129
129 -
 130
130 -
 131
131 -
 132
132 -
 133
133 -
 134
134 -
 135
135 -
 136
136 -
 137
137 -
 138
138 -
 139
139 -
 140
140 -
 141
141 -
 142
142 -
 143
143 -
 144
144 -
 145
145 -
 146
146 -
 147
147 -
 148
148 -
149
-
150
-
151
-
152
-
153
-
154
 |
 |

BANK OF AMERICA 2004 137
Qualified Nonqualified Postretirement
Pension Plans(1) Pension Plans(1) Health and Life Plans(1)
(Dollars in millions) 2004 2003 2004 2003 2004 2003
Change in fair value of plan assets
(Primarily listed stocks, fixed income and real estate)
Fair value, January 1 $ 8,975 $ 7,518 $– $– $ 156 $ 181
FleetBoston balance, April 1, 2004 2,277 –1–45 –
Actual return on plan assets 1,447 1,671 ––25 25
Company contributions(2) 200 400 63 47 40 13
Plan participant contributions ––––82 62
Benefits paid (746) (614) (63) (47) (182) (125)
Fair value, December 31 $12,153 $ 8,975 $1 $– $ 166 $ 156
Change in projected benefit obligation
Projected benefit obligation, January 1 $ 8,428 $ 7,627 $ 712 $ 652 $ 1,127 $ 1,058
FleetBoston balance, April 1, 2004 2,045 –377 –196 –
Service cost 257 187 27 25 99
Interest cost 623 514 62 45 76 68
Plan participant contributions ––––82 62
Plan amendments 19 –(74) –(12) (36)
Actuarial loss 835 714 53 37 56 91
Benefits paid (746) (614) (63) (47) (182) (125)
Projected benefit obligation, December 31 $11,461 $ 8,428 $ 1,094 $ 712 $ 1,352 $ 1,127
Funded status, December 31
Accumulated benefit obligation (ABO) $11,025 $ 8,028 $ 1,080 $ 628 n/a n/a
Overfunded (unfunded) status of ABO 1,128 947 (1,079) (628) n/a n/a
Provision for future salaries 436 400 14 84 n/a n/a
Projected benefit obligation (PBO) 11,461 8,428 1,094 712 $ 1,352 $ 1,127
Overfunded (unfunded) status of PBO $ 692 $ 547 $ (1,093) $ (712) $ (1,186) $ (971)
Unrecognized net actuarial loss 2,364 2,153 234 195 112 139
Unrecognized transition obligation ––––252 291
Unrecognized prior service cost 328 364 (59) 18 –6
Prepaid (accrued) benefit cost $ 3,384 $ 3,064 $ (918) $ (499) $ (822) $ (535)
Weighted average assumptions, December 31
Discount rate(3) 5.75% 6.25% 5.75% 6.25% 5.75% 6.25%
Expected return on plan assets 8.50 8.50 n/a n/a 8.50 8.50
Rate of compensation increase 4.00 4.00 4.00 4.00 n/a n/a
(1) The measurement date for the Qualified Pension Plans, Nonqualified Pension Plans, and Postretirement Health and Life Plans was December 31 of each year reported.
(2) The Corporation’s best estimate of its contributions to be made to the Qualified Pension Plans, Nonqualified Pension Plans, and Postretirement Health and Life Plans in 2005 is $0, $114 and $37,
respectively.
(3) In connection with the Merger, the plans of former FleetBoston were remeasured on April 1, 2004, using a discount rate of 6 percent.
n/a = not applicable
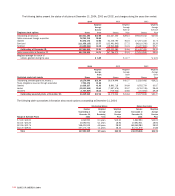
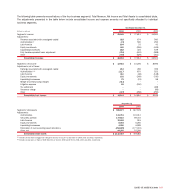
The following table summarizes the changes in the fair value of
plan assets, changes in the projected benefit obligation (PBO), the
funded status of both the accumulated benefit obligation (ABO) and
the PBO, and the weighted average assumptions used to determine
benefit obligations for the pension plans and postretirement plans at
December 31, 2004 and 2003. Prepaid and accrued benefit costs
are reflected in Other Assets, and Accrued Expenses and Other
Liabilities, respectively, on the Consolidated Balance Sheet. The dis-
count rate assumption is based on the internal rate of return for a
portfolio of high quality bonds (Moody’s Aa Corporate bonds) with
maturities that are consistent with projected future cash flows. For
the Pension Plan and the FleetBoston Pension Plan (the Qualified
Pension Plans), as well as the Postretirement Health and Life Plans,
the discount rate at December 31, 2004, was 5.75 percent. For both
the Qualified Pension Plans and the Postretirement Health and Life
Plans, the expected long-term return on plan assets will be 8.50 per-
cent for 2005. The expected return on plan assets is determined
using the calculated market-related value for the Qualified Pension
Plans and the fair value for the Postretirement Health and Life Plans.
The asset valuation method for the Qualified Pension Plans recog-
nizes 60 percent of the market gains or losses in the first year, with
the remaining 40 percent spread equally over the next four years.