Bank of America 2004 Annual Report Download - page 40
Download and view the complete annual report
Please find page 40 of the 2004 Bank of America annual report below. You can navigate through the pages in the report by either clicking on the pages listed below, or by using the keyword search tool below to find specific information within the annual report.-
 1
1 -
2
-
3
-
4
-
5
-
6
-
7
-
8
-
9
-
10
-
11
-
12
-
13
-
14
-
15
-
16
-
17
-
18
-
19
-
20
-
21
-
22
-
23
-
24
-
25
-
26
-
27
-
28
-
29
-
 30
30 -
 31
31 -
 32
32 -
 33
33 -
 34
34 -
 35
35 -
 36
36 -
 37
37 -
 38
38 -
 39
39 -
 40
40 -
 41
41 -
 42
42 -
 43
43 -
 44
44 -
 45
45 -
 46
46 -
 47
47 -
 48
48 -
 49
49 -
 50
50 -
51
-
52
-
53
-
54
-
55
-
56
-
57
-
58
-
59
-
60
-
61
-
62
-
63
-
64
-
65
-
66
-
67
-
68
-
69
-
70
-
71
-
72
-
73
-
74
-
75
-
76
-
77
-
78
-
79
-
80
-
81
-
82
-
83
-
84
-
85
-
86
-
87
-
88
-
89
-
90
-
91
-
92
-
93
-
94
-
95
-
96
-
97
-
98
-
99
-
100
-
101
-
102
-
103
-
104
-
105
-
106
-
107
-
108
-
109
-
110
-
111
-
112
-
113
-
114
-
115
-
116
-
117
-
118
-
119
-
120
-
121
-
122
-
123
-
124
-
125
-
126
-
127
-
128
-
129
-
130
-
131
-
132
-
133
-
134
-
135
-
136
-
137
-
138
-
139
-
140
-
141
-
142
-
143
-
144
-
145
-
146
-
147
-
148
-
149
-
150
-
151
-
152
-
153
-
154
 |
 |

BANK OF AMERICA 2004 39
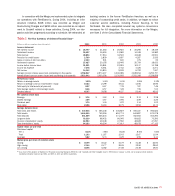
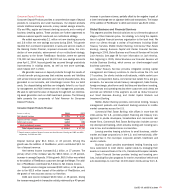
Table 2
Supplemental Financial Data and Reconciliations to GAAP Financial Measures
(Dollars in millions, except per share information) 2004 2003 2002 2001 2000
Operating basis(1,2)
Operating earnings $ 14,554 $ 10,810 $ 9,249 $ 8,042 $ 7,863
Operating earnings per common share 3.87 3.63 3.04 2.52 2.39
Diluted operating earnings per common share 3.80 3.57 2.95 2.47 2.36
Shareholder value added 5,983 5,621 3,760 3,087 3,081
Return on average assets 1.39% 1.44% 1.41% 1.25% 1.17%
Return on average common shareholders’ equity 17.32 21.99 19.44 16.53 16.70
Efficiency ratio (fully taxable-equivalent basis) 53.23 52.27 52.56 55.47 54.38
Dividend payout ratio 44.38 39.58 40.07 45.13 43.04
Fully taxable-equivalent basis data
Net interest income $ 29,513 $ 22,107 $ 21,511 $ 20,633 $ 18,671
Total revenue 49,610 38,557 35,091 34,981 33,253
Net interest yield 3.26% 3.40% 3.77% 3.68% 3.20%
Efficiency ratio 54.48 52.27 52.56 59.20 56.03
Reconciliation of net income to operating earnings
Net income $ 14,143 $ 10,810 $ 9,249 $ 6,792 $ 7,517
Merger and restructuring charges 618 – – 1,700 550
Related income tax benefit (207) – – (450) (204)
Operating earnings $ 14,554 $ 10,810 $ 9,249 $ 8,042 $ 7,863
Reconciliation of EPS to operating EPS
Earnings per common share $ 3.76 $ 3.63 $ 3.04 $ 2.13 $ 2.28
Effect of merger and restructuring charges, net of tax benefit 0.11 – – 0.39 0.11
Operating earnings per common share $ 3.87 $ 3.63 $ 3.04 $ 2.52 $ 2.39
Reconciliation of diluted EPS to diluted operating EPS
Diluted earnings per common share $ 3.69 $ 3.57 $ 2.95 $ 2.09 $ 2.26
Effect of merger and restructuring charges, net of tax benefit 0.11 – – 0.38 0.10
Diluted operating earnings per common share $ 3.80 $ 3.57 $ 2.95 $ 2.47 $ 2.36
Reconciliation of net income to shareholder value added
Net income $ 14,143 $ 10,810 $ 9,249 $ 6,792 $ 7,517
Amortization of intangibles 664 217 218 878 864
Merger and restructuring charges, net of tax benefit 411 – – 1,250 346
Cash basis earnings on an operating basis 15,218 11,027 9,467 8,920 8,727
Capital charge (9,235) (5,406) (5,707) (5,833) (5,646)
Shareholder value added $ 5,983 $ 5,621 $ 3,760 $ 3,087 $ 3,081
Reconciliation of return on average assets to operating return on average assets
Return on average assets 1.35% 1.44% 1.41% 1.05% 1.12%
Effect of merger and restructuring charges, net of tax benefit 0.04 – – 0.20 0.05
Operating return on average assets 1.39% 1.44% 1.41% 1.25% 1.17%
Reconciliation of return on average common shareholders’ equity
to operating return on average common shareholders’ equity
Return on average common shareholders’ equity 16.83% 21.99% 19.44% 13.96% 15.96%
Effect of merger and restructuring charges, net of tax benefit 0.49 – – 2.57 0.74
Operating return on average common shareholders’ equity 17.32% 21.99% 19.44% 16.53% 16.70%
Reconciliation of efficiency ratio to operating efficiency ratio
(fully taxable-equivalent basis)
Efficiency ratio 54.48% 52.27% 52.56% 59.20% 56.03%
Effect of merger and restructuring charges, net of tax benefit (1.25) – – (3.73) (1.65)
Operating efficiency ratio 53.23% 52.27% 52.56% 55.47% 54.38%
Reconciliation of dividend payout ratio to operating dividend payout ratio
Dividend payout ratio 45.67% 39.58% 40.07% 53.44% 45.02%
Effect of merger and restructuring charges, net of tax benefit (1.29) – – (8.31) (1.98)
Operating dividend payout ratio 44.38% 39.58% 40.07% 45.13% 43.04%
(1) Operating basis excludes Merger and Restructuring Charges. Merger and Restructuring Charges were $618 and $550 in 2004 and 2000, respectively. Merger and Restructuring Charges in 2001 repre-
sented Provision for Credit Losses of $395 and Noninterest Expense of $1,305, both of which were related to the exit of certain consumer finance businesses.
(2) As a result of the adoption of SFAS 142 on January 1, 2002, we no longer amortize Goodwill. Goodwill amortization expense was $662 and $635 in 2001 and 2000, respectively.