Bank of America 2004 Annual Report Download - page 50
Download and view the complete annual report
Please find page 50 of the 2004 Bank of America annual report below. You can navigate through the pages in the report by either clicking on the pages listed below, or by using the keyword search tool below to find specific information within the annual report.-
 1
1 -
2
-
3
-
4
-
5
-
6
-
7
-
8
-
9
-
10
-
11
-
12
-
13
-
14
-
15
-
16
-
17
-
18
-
19
-
20
-
21
-
22
-
23
-
24
-
25
-
26
-
27
-
28
-
29
-
30
-
31
-
32
-
33
-
34
-
35
-
36
-
37
-
38
-
39
-
 40
40 -
 41
41 -
 42
42 -
 43
43 -
 44
44 -
 45
45 -
 46
46 -
 47
47 -
 48
48 -
 49
49 -
 50
50 -
 51
51 -
 52
52 -
 53
53 -
 54
54 -
 55
55 -
 56
56 -
 57
57 -
 58
58 -
 59
59 -
 60
60 -
61
-
62
-
63
-
64
-
65
-
66
-
67
-
68
-
69
-
70
-
71
-
72
-
73
-
74
-
75
-
76
-
77
-
78
-
79
-
80
-
81
-
82
-
83
-
84
-
85
-
86
-
87
-
88
-
89
-
90
-
91
-
92
-
93
-
94
-
95
-
96
-
97
-
98
-
99
-
100
-
101
-
102
-
103
-
104
-
105
-
106
-
107
-
108
-
109
-
110
-
111
-
112
-
113
-
114
-
115
-
116
-
117
-
118
-
119
-
120
-
121
-
122
-
123
-
124
-
125
-
126
-
127
-
128
-
129
-
130
-
131
-
132
-
133
-
134
-
135
-
136
-
137
-
138
-
139
-
140
-
141
-
142
-
143
-
144
-
145
-
146
-
147
-
148
-
149
-
150
-
151
-
152
-
153
-
154
 |
 |

BANK OF AMERICA 2004 49
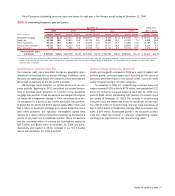
Total Revenue for Global Wealth and Investment Management
increased $1.9 billion, or 47 percent, for 2004. The Provision for
Credit Losses decreased $31 million to a negative $20 million. Total
Noninterest Expense increased $1.3 billion to $3.4 billion. Net Income
increased 28 percent to $1.6 billion. SVA decreased $72 million, or eight
percent, as the increase in cash basis earnings was more than offset
by the increase in the capital allocation that resulted from the Merger.
Net Interest Income increased 46 percent to $2.9 billion due to
growth in Deposits in both Premier Banking and The Private Bank,
loan growth in The Private Bank, and the addition of FleetBoston earn-
ing assets to the portfolio. Net results of ALM activities also drove
the increase. Average Deposits increased $29.1 billion, or 54 percent,
primarily due to migration of account balances from Consumer
Banking to Premier Banking, the impact of the Merger, as well as
increased deposit-taking in The Private Bank. Average Loans and
Leases increased $6.4 billion, or 17 percent, due to the inclusion of
the FleetBoston Loans and Leases and increased loan activity in The
Private Bank.
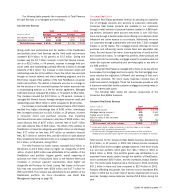
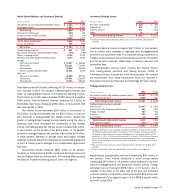
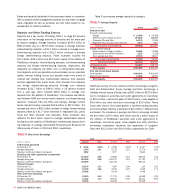
Client Assets
December 31
(Dollars in billions) 2004 2003
Assets under management $ 451.5 $ 296.7
Client brokerage assets 149.9 88.8
Assets in custody 107.0 49.9
Total client assets $ 708.4 $ 435.4
Assets under management generate fees based on a percentage of
their market value. They consist largely of mutual funds and separate
accounts, which are comprised of money market products, equities,
and taxable and nontaxable fixed income securities. Compared to
2003, assets under management increased $154.8 billion, or 52 per-
cent, due to the addition of $148.9 billion of FleetBoston assets under
management and increased market valuation partially offset by out-
flows primarily in money market products. Client brokerage assets, a
source of commission revenue, were up $61.1 billion, or 69 percent,
due to the addition of $55.4 billion FleetBoston client brokerage
assets. Client brokerage assets consist largely of investments in
annuities, money market mutual funds, bonds and equities. Assets in
custody increased $57.1 billion, or 114 percent, and represent trust
assets administered for customers. The addition of $54.5 billion of
assets in custody from FleetBoston drove the increase. Trust assets
encompass a broad range of asset types including real estate, private
company ownership interest, personal property and investments.
Noninterest Income consists primarily of Investment and
Brokerage Services, which represents fees earned on client assets,
as well as brokerage commissions and trailer fees. Investment and
Brokerage Services revenue increased $1.1 billion, or 71 percent, to
$2.7 billion. The increase in Investment and Brokerage Services
revenue was primarily due to growth in all client assets categories,
driven by the addition of FleetBoston. The impact of FleetBoston on
Investment and Brokerage Services was $974 million.
Noninterest Expense increased $1.3 billion, or 64 percent, due
to the $889 million increase in expenses related to the inclusion of
FleetBoston and this segment’s allocation of the mutual fund settle-
ment, which amounted to approximately $143 million pre-tax. Also
impacting Noninterest Expense was an increase in Personnel
Expense reflecting the addition of 637 client managers in Premier
Banking, additional financial advisors in BAI and increased incentives
in BAI due to increased sales and changes to payout schedules.
All Other
Included in All Other are our Latin America and Equity Investments
businesses, and Other.
Latin America includes our full-service Latin American operations
in Brazil, Argentina and Chile. These businesses provide a wide array
of products to indigenous and multinational corporations, as well as
consumers. These services include lending, deposit-taking, asset
management, private banking and treasury operations. The consumer
business focuses on the affluent and middle-market segments. Our
largest book of business is in Brazil, while Argentina has our largest
branch network, with 87 branches. Our Brazilian and Chilean opera-
tions have 65 branches and 43 branches, respectively. Beginning in
2005, Latin America will be re-aligned with the Global Business and
Financial Services segment. For more information on our Latin
American operations, see Foreign Portfolio beginning on page 64.
Equity Investments include Principal Investing and other corporate
investments. Principal Investing is comprised of a diversified portfolio
of investments in privately-held and publicly-traded companies at all
stages of their lifecycle from start-up to buyout.
Other includes Noninterest Income and Expense amounts
associated with the ALM process, including Gains on Sales of Debt
Securities, the allowance for credit losses process, the residual
impact of methodology allocations, intersegment eliminations, and
the results of certain consumer finance and commercial lending busi-
nesses that are being liquidated.
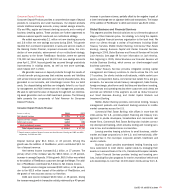
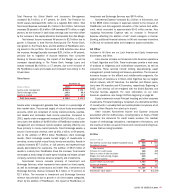
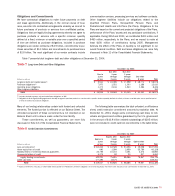
All Other
(Dollars in millions) 2004 2003
Net interest income (fully taxable-equivalent basis) $ 636 $ 634
Noninterest income 428 112
Total revenue 1,064 746
Provision for credit losses 148 389
Gains on sales of debt securities 2,016 942
Merger and restructuring charges 618 –
Noninterest expense 594 597
Income before income taxes 1,720 702
Income tax expense 492 97
Net income $ 1,228 $ 605
Shareholder value added $36 $ (1,339)