Bank of America 2004 Annual Report Download - page 62
Download and view the complete annual report
Please find page 62 of the 2004 Bank of America annual report below. You can navigate through the pages in the report by either clicking on the pages listed below, or by using the keyword search tool below to find specific information within the annual report.-
 1
1 -
2
-
3
-
4
-
5
-
6
-
7
-
8
-
9
-
10
-
11
-
12
-
13
-
14
-
15
-
16
-
17
-
18
-
19
-
20
-
21
-
22
-
23
-
24
-
25
-
26
-
27
-
28
-
29
-
30
-
31
-
32
-
33
-
34
-
35
-
36
-
37
-
38
-
39
-
40
-
41
-
42
-
43
-
44
-
45
-
46
-
47
-
48
-
49
-
50
-
51
-
 52
52 -
 53
53 -
 54
54 -
 55
55 -
 56
56 -
 57
57 -
 58
58 -
 59
59 -
 60
60 -
 61
61 -
 62
62 -
 63
63 -
 64
64 -
 65
65 -
 66
66 -
 67
67 -
 68
68 -
 69
69 -
 70
70 -
 71
71 -
 72
72 -
73
-
74
-
75
-
76
-
77
-
78
-
79
-
80
-
81
-
82
-
83
-
84
-
85
-
86
-
87
-
88
-
89
-
90
-
91
-
92
-
93
-
94
-
95
-
96
-
97
-
98
-
99
-
100
-
101
-
102
-
103
-
104
-
105
-
106
-
107
-
108
-
109
-
110
-
111
-
112
-
113
-
114
-
115
-
116
-
117
-
118
-
119
-
120
-
121
-
122
-
123
-
124
-
125
-
126
-
127
-
128
-
129
-
130
-
131
-
132
-
133
-
134
-
135
-
136
-
137
-
138
-
139
-
140
-
141
-
142
-
143
-
144
-
145
-
146
-
147
-
148
-
149
-
150
-
151
-
152
-
153
-
154
 |
 |

BANK OF AMERICA 2004 61
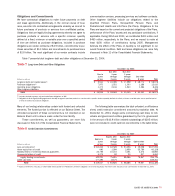
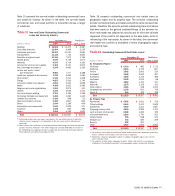
On-balance-sheet credit card net charge-offs increased $791 million
to $2.3 billion in 2004. The $6.8 billion of credit card loans acquired
from FleetBoston on April 1, 2004 accounted for $320 million in net
charge-offs. Other causes of the increase in credit card charge-offs
were organic growth, the continued seasoning of accounts, and the
return of $4.2 billion of previously securitized loan balances to the
balance sheet. Formerly securitized credit card loans are recorded on
the balance sheet after the revolving period of the securitization,
which has the effect of increasing loans on the balance sheet,
increasing Net Interest Income, Provision for Credit Losses and net
charge-offs, while reducing Noninterest Income.
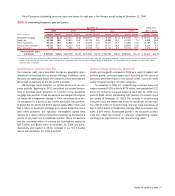
Included in Other Assets were consumer loans held-for-sale of
$6.1 billion and $6.8 billion at December 31, 2004 and 2003,
respectively. Included in these balances were nonperforming con-
sumer loans held-for-sale of $28 million and $16 million at December
31, 2004 and 2003, respectively.
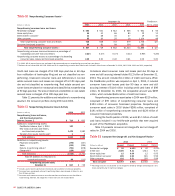
Commercial Portfolio Credit Risk Management
Credit risk management for the commercial portfolio begins with an
assessment of the credit risk profile of the borrower or counterparty
based on an analysis of the borrower’s or counterparty’s financial
position. As part of the overall credit risk assessment of a borrower
or counterparty, each commercial credit exposure or transaction is
assigned a risk rating and is subject to approval based on defined
credit approval standards. Subsequent to loan origination, risk rat-
ings are monitored on an ongoing basis. If necessary, they are
adjusted to reflect changes in the borrower’s or counterparty’s finan-
cial condition, cash flow or financial situation. We use risk rating
aggregations to measure and evaluate concentrations within portfo-
lios. Risk ratings are a factor in determining the level of assigned eco-
nomic capital and the allowance for credit losses. In making
decisions regarding credit, we consider risk rating, collateral, country,
industry and single name concentration limits while also balancing
the total borrower or counterparty relationship and SVA.
Our lines of business and Risk Management personnel use a
variety of tools to continuously monitor a borrower’s or counterparty’s
ability to perform under its obligations. Adjustments in credit expo-
sures are made as a result of this ongoing analysis and review.
Additionally, we utilize syndication of exposure to other entities, loan
sales and other risk mitigation techniques to manage the size and
risk profile of the loan portfolio.
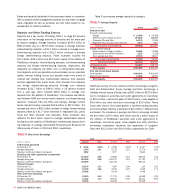
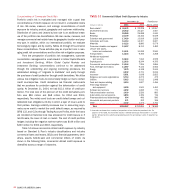
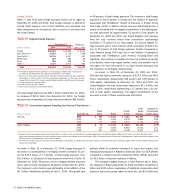
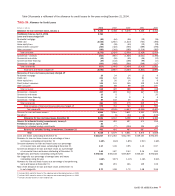
Table 13 presents outstanding commercial loans and leases for
each year in the five-year period ending at December 31, 2004.
Table 13
Outstanding Commercial Loans and Leases
December 31 FleetBoston
2004 2003 2002 2001 2000 April 1, 2004
■■■■■
(Dollars in millions) Amount Percent Amount Percent Amount Percent Amount Percent Amount Percent Amount Percent
■■■■■
Commercial – domestic $122,095 62.9% $ 91,491 69.7% $ 99,151 68.3% $110,981 67.7% $138,367 68.0% $ 31,796 51.6%
Commercial real estate(1) 32,319 16.7 19,367 14.7 20,205 13.9 22,655 13.8 26,436 13.0 9,982 16.2
Commercial lease financing 21,115 10.9 9,692 7.4 10,386 7.2 11,404 7.0 11,888 5.8 10,720 17.4
Commercial – foreign 18,401 9.5 10,754 8.2 15,428 10.6 18,858 11.5 26,851 13.2 9,160 14.8
■■■■■
Total commercial loans
and leases $193,930 100.0% $131,304 100.0% $145,170 100.0% $163,898 100.0% $203,542 100.0% $ 61,658 100.0%
■■■■■
(1) Includes domestic commercial real estate loans of $31,879, $19,043, $19,910, $22,272 and $26,154 at December 31, 2004, 2003, 2002, 2001 and 2000, respectively; and foreign commercial real
estate loans of $440, $324, $295, $383 and $282 at December 31, 2004, 2003, 2002, 2001 and 2000, respectively.