Bank of America 2004 Annual Report Download - page 51
Download and view the complete annual report
Please find page 51 of the 2004 Bank of America annual report below. You can navigate through the pages in the report by either clicking on the pages listed below, or by using the keyword search tool below to find specific information within the annual report.-
 1
1 -
2
-
3
-
4
-
5
-
6
-
7
-
8
-
9
-
10
-
11
-
12
-
13
-
14
-
15
-
16
-
17
-
18
-
19
-
20
-
21
-
22
-
23
-
24
-
25
-
26
-
27
-
28
-
29
-
30
-
31
-
32
-
33
-
34
-
35
-
36
-
37
-
38
-
39
-
40
-
 41
41 -
 42
42 -
 43
43 -
 44
44 -
 45
45 -
 46
46 -
 47
47 -
 48
48 -
 49
49 -
 50
50 -
 51
51 -
 52
52 -
 53
53 -
 54
54 -
 55
55 -
 56
56 -
 57
57 -
 58
58 -
 59
59 -
 60
60 -
 61
61 -
62
-
63
-
64
-
65
-
66
-
67
-
68
-
69
-
70
-
71
-
72
-
73
-
74
-
75
-
76
-
77
-
78
-
79
-
80
-
81
-
82
-
83
-
84
-
85
-
86
-
87
-
88
-
89
-
90
-
91
-
92
-
93
-
94
-
95
-
96
-
97
-
98
-
99
-
100
-
101
-
102
-
103
-
104
-
105
-
106
-
107
-
108
-
109
-
110
-
111
-
112
-
113
-
114
-
115
-
116
-
117
-
118
-
119
-
120
-
121
-
122
-
123
-
124
-
125
-
126
-
127
-
128
-
129
-
130
-
131
-
132
-
133
-
134
-
135
-
136
-
137
-
138
-
139
-
140
-
141
-
142
-
143
-
144
-
145
-
146
-
147
-
148
-
149
-
150
-
151
-
152
-
153
-
154
 |
 |

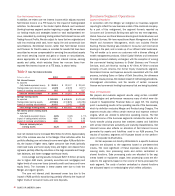
Latin America
The results of Latin America are driven by the addition of the
FleetBoston operations in the region. For more information on our
Latin American operations, see Foreign Portfolio beginning on page
64. Prior to the Merger, our business in the region had been reduced
to very low levels. For 2004, Latin America reported Net Income of
$310 million compared to a Net Loss of $48 million in 2003. Total
Revenue increased $801 million from $33 million to $834 million.
The results reflect an improvement in credit quality including the dis-
position of problem assets, as well as improved economic conditions
in the region. Our increased presence in the region as a result of the
addition of the FleetBoston business also contributed to the results.
SVA increased by $227 million due to higher Net Income.
Net Interest Income increased $470 million from $24 million to
$494 million. The increase was driven by the $458 million impact of
the addition of the FleetBoston Latin America business.
Noninterest Income increased $331 million from $9 million to
$340 million in 2004. The increase was driven by increases in Service
Charges, Investment and Brokerage Services and Trading Account
Profits of $78 million, $77 million and $72 million, respectively, due
to the addition of FleetBoston.
The Provision for Credit Losses decreased $284 million from
$89 million in 2003 to a negative $195 million, due to continued
improvement in the credit quality of the portfolio. Driving this
decrease was a reduction in net charge-offs of $113 million and
improved credit quality.
Noninterest Expense increased $509 million from $19 million to
$528 million for 2004 due to the $497 million impact of the addition
of the FleetBoston business.
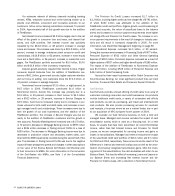
Equity Investments
Equity Investments reported Net Income of $192 million in 2004, a
$441 million improvement compared to a $249 million Net Loss in
2003. Total Revenue increased $696 million to $440 million. The
improvements were primarily due to higher gains in Principal Investing
driven by increasing liquidity in the private equity markets. SVA increased
by $364 million, or 77 percent, due to the improvement in the results.
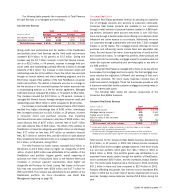
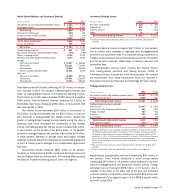
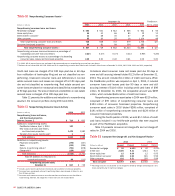
The following table presents the Principal Investing equity port-
folio by major industry at December 31, 2004 and 2003:
Principal Investing Equity Portfolio
December 31 FleetBoston
(Dollars in millions) 2004 2003 April 1, 2004
■■■■■■
Consumer discretionary $ 2,058 $ 1,435 $ 834
Industrials 1,118 876 527
Information technology 1,089 741 391
Telecommunication services 769 639 271
Financials 606 332 146
Healthcare 576 385 211
Materials 421 266 188
Consumer staples 230 245 88
Real estate 229 229 113
Energy 81 29 67
Individual trusts,
nonprofits, government 49 48 162
Utilities 24 35 6
■■■■■■
Total $ 7,250 $ 5,260 $ 3,004
■■■■■■
Noninterest Income within the Principal Investing portfolio primarily
consists of Equity Investment Gains (Losses), and increased $712
million to $594 million. While impairments were relatively unchanged
at $445 million, cash gains increased by $576 million to $849 million.
Also contributing to the improvement was an increase of $143 million
in fair value adjustment gains.
Other
Other recorded $726 million of Net Income in 2004, compared to
$902 million in 2003. Total Revenue decreased $1.2 billion to a
negative $210 million. The decrease was the result of a $440 million
decrease in Net Interest Income, from $771 million to $331 million,
primarily caused by a reduction of capital in Other, as more capital
has been deployed to the business segments, and by the continued
runoff of previously exited businesses. The revenue decrease was
also caused by the $739 million decline in Noninterest Income pri-
marily caused by the absence of whole mortgage loan sale gains dur-
ing 2004. Gains on Sales of Debt Securities increased $1.1 billion to
$2.0 billion as we continue to reposition the ALM portfolio in
response to interest rate fluctuations and to manage mortgage pre-
payment risk. Provision for Credit Losses increased $65 million
resulting from higher ALM whole loan mortgage portfolio levels,
changes to components of the formula and other factors, partially offset
by reduced credit costs associated with previously exited businesses.
Noninterest Expense increased $87 million to $555 million, and
included Merger and Restructuring Charges of $618 million offset by
costs allocated to the segments. For more information on Merger and
Restructuring Charges, see Note 2 of the Consolidated Financial
Statements.
50 BANK OF AMERICA 2004