Bank of America 2004 Annual Report Download - page 140
Download and view the complete annual report
Please find page 140 of the 2004 Bank of America annual report below. You can navigate through the pages in the report by either clicking on the pages listed below, or by using the keyword search tool below to find specific information within the annual report.-
 1
1 -
2
-
3
-
4
-
5
-
6
-
7
-
8
-
9
-
10
-
11
-
12
-
13
-
14
-
15
-
16
-
17
-
18
-
19
-
20
-
21
-
22
-
23
-
24
-
25
-
26
-
27
-
28
-
29
-
30
-
31
-
32
-
33
-
34
-
35
-
36
-
37
-
38
-
39
-
40
-
41
-
42
-
43
-
44
-
45
-
46
-
47
-
48
-
49
-
50
-
51
-
52
-
53
-
54
-
55
-
56
-
57
-
58
-
59
-
60
-
61
-
62
-
63
-
64
-
65
-
66
-
67
-
68
-
69
-
70
-
71
-
72
-
73
-
74
-
75
-
76
-
77
-
78
-
79
-
80
-
81
-
82
-
83
-
84
-
85
-
86
-
87
-
88
-
89
-
90
-
91
-
92
-
93
-
94
-
95
-
96
-
97
-
98
-
99
-
100
-
101
-
102
-
103
-
104
-
105
-
106
-
107
-
108
-
109
-
110
-
111
-
112
-
113
-
114
-
115
-
116
-
117
-
118
-
119
-
120
-
121
-
122
-
123
-
124
-
125
-
126
-
127
-
128
-
129
-
 130
130 -
 131
131 -
 132
132 -
 133
133 -
 134
134 -
 135
135 -
 136
136 -
 137
137 -
 138
138 -
 139
139 -
 140
140 -
 141
141 -
 142
142 -
 143
143 -
 144
144 -
 145
145 -
 146
146 -
 147
147 -
 148
148 -
 149
149 -
 150
150 -
151
-
152
-
153
-
154
 |
 |

BANK OF AMERICA 2004 139
$56 million, respectively, in 2004, $4 million and $52 million, respec-
tively, in 2003, and $5 million and $61 million, respectively, in 2002.
A one-percentage-point decrease in assumed health care cost trend
rates would have lowered the service and interest costs and the ben-
efit obligation by $3 million and $48 million, respectively, in 2004, $3
million and $48 million, respectively, in 2003, and $4 million and $52
million, respectively, in 2002.
Plan Assets
The Qualified Pension Plans have been established as retirement
vehicles for participants, and trusts have been established to secure
benefits promised under the Qualified Pension Plans. The
Corporation’s policy is to invest the trust assets in a prudent manner
for the exclusive purpose of providing benefits to participants and
defraying reasonable expenses of administration. The Corporation’s
investment strategy is designed to provide a total return that, over
the long-term, increases the ratio of assets to liabilities. The strategy
attempts to maximize the investment return on assets at a level of
risk deemed appropriate by the Corporation while complying with
ERISA and any subsequent applicable regulations and laws. The
investment strategy utilizes asset allocation as a principal determi-
nant for establishing the risk/reward profile of the assets. Asset allo-
cation ranges are established, periodically reviewed, and adjusted as
funding levels and liability characteristics change. Active and passive
investment managers are employed to help enhance the risk/return
profile of the assets. An additional aspect of the investment strategy
used to minimize risk (part of the asset allocation plan) includes
matching the equity exposure of participant-selected earnings meas-
ures. For example, the common stock of the Corporation held in the
trust is maintained as an offset to the exposure related to partici-
pants who selected to receive an earnings measure based on the
return performance of common stock of the Corporation.
The Expected Return on Asset Assumption (EROA assumption)
was developed through analysis of historical market returns, histori-
cal asset class volatility and correlations, current market conditions,
anticipated future asset allocations, the funds’ past experience, and
expectations on potential future market returns. The EROA assump-
tion represents a long-term average view of the performance of the
Qualified Pension Plans and Postretirement Health and Life Plan
assets, a return that may or may not be achieved during any one cal-
endar year. In a simplistic analysis of the EROA assumption, the build-
ing blocks used to arrive at the long-term return assumption would
include an implied return from equity securities of 9 percent, debt
securities of 6 percent, and real estate of 9 percent for all pension
plans and postretirement health and life plans.
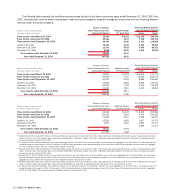
The Qualified Pension Plans’ asset allocation at December 31,
2004 and 2003 and target allocation for 2005 by asset category are
as follows:
Percentage of Plan Assets
2005 Target at December 31
Asset Category Allocation 2004 2003
Equity securities 65 -80% 75% 71%
Debt securities 20- 35% 23 28
Real estate 0-3% 21
Total 100% 100%
Equity securities include common stock of the Corporation in the
amounts of $871 million (7.17 percent of total plan assets) and
$809 million (9.02 percent of total plan assets) at December 31,
2004 and 2003, respectively.
The Postretirement Health and Life Plans’ asset allocation at
December 31, 2004 and 2003 and target allocation for 2005 by
asset category are as follows:
Percentage of Plan Assets
2005 Target at December 31
Asset Category Allocation 2004 2003
Equity securities 60 -75% 75% 69%
Debt securities 22- 40% 24 31
Real estate 0-3% 1–
Total 100% 100%
The Bank of America Postretirement Health and Life Plans had no
investment in the common stock of the Corporation at December 31,
2004 or 2003. The FleetBoston Postretirement Health and Life Plans
included common stock of the Corporation in the amount of $0.3 mil-
lion (0.20 percent of total plan assets) at December 31, 2004.
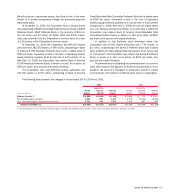
Projected Benefit Payments
Benefit payments projected to be made from the Qualified Pension
Plans, the Nonqualified Pension Plans and the Postretirement Health
and Life Plans are as follows: Postretirement
Qualified Nonqualified Health and Life Plans
Pension Pension Net Medicare
(Dollars in millions) Plans(1) Plans(2) Payments(3) Subsidy
2005 $ 806 $ 114 $ 109 $ –
2006 831 89 109 (6)
2007 856 81 107 (6)
2008 881 93 104 (6)
2009 908 92 101 (6)
2010-2014 4,803 519 457 (26)
(1) Benefit payments expected to be made from the plans’ assets.
(2) Benefit payments expected to be made from the Corporation’s assets.
(3) Benefit payments (net of retiree contributions) expected to be made from a combination of the
plans’ and the Corporation’s assets.