Bank of America 2004 Annual Report Download - page 76
Download and view the complete annual report
Please find page 76 of the 2004 Bank of America annual report below. You can navigate through the pages in the report by either clicking on the pages listed below, or by using the keyword search tool below to find specific information within the annual report.-
 1
1 -
2
-
3
-
4
-
5
-
6
-
7
-
8
-
9
-
10
-
11
-
12
-
13
-
14
-
15
-
16
-
17
-
18
-
19
-
20
-
21
-
22
-
23
-
24
-
25
-
26
-
27
-
28
-
29
-
30
-
31
-
32
-
33
-
34
-
35
-
36
-
37
-
38
-
39
-
40
-
41
-
42
-
43
-
44
-
45
-
46
-
47
-
48
-
49
-
50
-
51
-
52
-
53
-
54
-
55
-
56
-
57
-
58
-
59
-
60
-
61
-
62
-
63
-
64
-
65
-
 66
66 -
 67
67 -
 68
68 -
 69
69 -
 70
70 -
 71
71 -
 72
72 -
 73
73 -
 74
74 -
 75
75 -
 76
76 -
 77
77 -
 78
78 -
 79
79 -
 80
80 -
 81
81 -
 82
82 -
 83
83 -
 84
84 -
 85
85 -
 86
86 -
87
-
88
-
89
-
90
-
91
-
92
-
93
-
94
-
95
-
96
-
97
-
98
-
99
-
100
-
101
-
102
-
103
-
104
-
105
-
106
-
107
-
108
-
109
-
110
-
111
-
112
-
113
-
114
-
115
-
116
-
117
-
118
-
119
-
120
-
121
-
122
-
123
-
124
-
125
-
126
-
127
-
128
-
129
-
130
-
131
-
132
-
133
-
134
-
135
-
136
-
137
-
138
-
139
-
140
-
141
-
142
-
143
-
144
-
145
-
146
-
147
-
148
-
149
-
150
-
151
-
152
-
153
-
154
 |
 |
BANK OF AMERICA 2004 75
Approximately $4 million of the increase in average VAR for 2004 was
attributable to the addition of FleetBoston in the second quarter of
2004. The remaining increase in average VAR for 2004 was primarily
due to increases in the average risk taken in credit and equities. The
increase in equities was mainly due to the increased economic risk
from customer-facilitated transactions that were held in inventory dur-
ing portions of 2004. The increase in credit was mainly due to an
increase in credit protection purchased to hedge the credit risk in our
commercial credit portfolio.
Stress Testing
Because the very nature of a VAR model suggests results can exceed
our estimates, we “stress test” our portfolio. Stress testing estimates
the value change in our trading portfolio due to abnormal market
movements. Various stress scenarios are run regularly against the
trading portfolio to verify that, even under extreme market moves, we
will preserve our capital; to determine the effects of significant his-
torical events; and to determine the effects of specific, extreme hypo-
thetical, but plausible events. The results of the stress scenarios are
calculated daily and reported to senior management as part of the
regular reporting process. The results of certain specific, extreme
hypothetical scenarios are presented to ALCO.
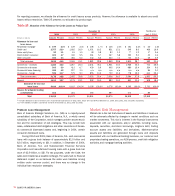
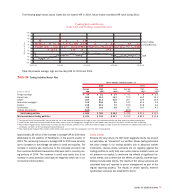
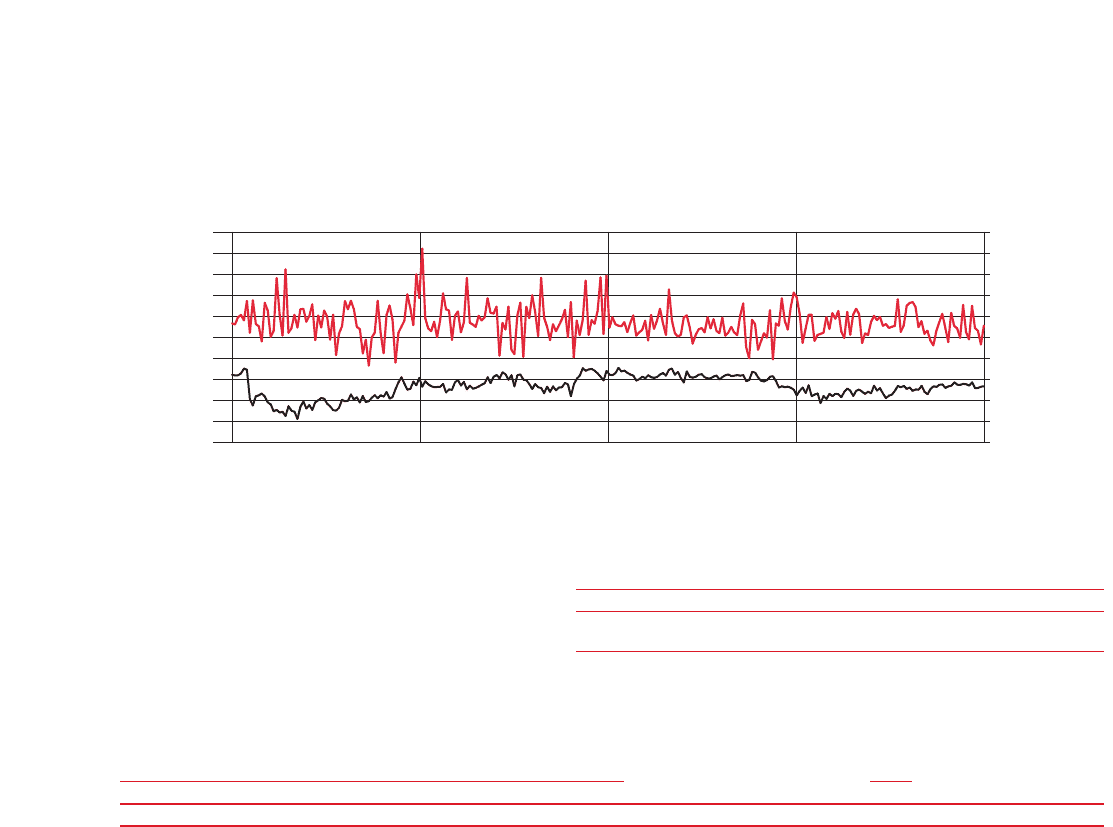
(Dollars in millions)
Trading Risk and Return
Daily VAR and Trading-related Revenue
12/31/03 3/31/04 6/30/04 9/30/04 12/31/04
Daily Trading-
related Revenue
VAR
-100
-80
60
0
-20
-40
-60
20
40
100
80
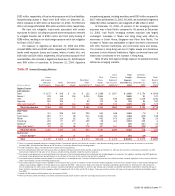
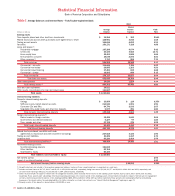
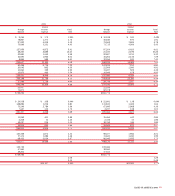
Table 26 presents average, high and low daily VAR for 2004 and 2003.
Table 26
Trading Activities Market Risk
Twelve Months Ended December 31
2004 2003
Average High Low Average High Low
(Dollars in millions) VAR VAR(1) VAR(1) VAR VAR(1) VAR(1)
Foreign exchange $ 3.6 $ 8.1 $ 1.4 $ 4.1 $ 7.8 $ 2.1
Interest rate 26.2 51.5 10.7 27.0 65.2 15.1
Credit(2) 35.7 61.4 21.9 20.7 32.6 14.9
Real estate/mortgage(3) 10.5 26.0 4.6 14.1 41.4 3.6
Equities 21.8 51.5 7.9 19.9 53.8 6.6
Commodities 6.5 10.2 3.8 8.7 19.3 4.1
Portfolio diversification (56.3) – – (60.9) – –
Total trading portfolio $ 48.0 $ 78.5 $ 29.4 $ 33.6 $ 91.0 $ 11.2
Total market-based trading portfolio(4) $ 44.1 $ 79.0 $ 23.7 $ 33.2 $ 82.0 $ 11.8
(1) The high and low for the total portfolio may not equal the sum of the individual components as the highs or lows of the individual portfolios may have occurred on different trading days.
(2) Credit includes credit fixed income and credit default swaps used for credit risk management. Average VAR for credit default swaps was $23.5 and $20.9 in 2004 and 2003, respectively.
(3) Real estate/mortgage includes capital market real estate and the Certificates. Effective June 1, 2004, Real estate/mortgage no longer includes the Certificates. For additional information on the
Certificates, see Note 1 of the Consolidated Financial Statements.
(4) Total market-based trading portfolio excludes credit default swaps used for credit risk management, net of the effect of diversification.
The following graph shows actual losses did not exceed VAR in 2004. Actual losses exceeded VAR twice during 2003.