Bank of America 2004 Annual Report Download - page 75
Download and view the complete annual report
Please find page 75 of the 2004 Bank of America annual report below. You can navigate through the pages in the report by either clicking on the pages listed below, or by using the keyword search tool below to find specific information within the annual report.-
 1
1 -
2
-
3
-
4
-
5
-
6
-
7
-
8
-
9
-
10
-
11
-
12
-
13
-
14
-
15
-
16
-
17
-
18
-
19
-
20
-
21
-
22
-
23
-
24
-
25
-
26
-
27
-
28
-
29
-
30
-
31
-
32
-
33
-
34
-
35
-
36
-
37
-
38
-
39
-
40
-
41
-
42
-
43
-
44
-
45
-
46
-
47
-
48
-
49
-
50
-
51
-
52
-
53
-
54
-
55
-
56
-
57
-
58
-
59
-
60
-
61
-
62
-
63
-
64
-
 65
65 -
 66
66 -
 67
67 -
 68
68 -
 69
69 -
 70
70 -
 71
71 -
 72
72 -
 73
73 -
 74
74 -
 75
75 -
 76
76 -
 77
77 -
 78
78 -
 79
79 -
 80
80 -
 81
81 -
 82
82 -
 83
83 -
 84
84 -
 85
85 -
86
-
87
-
88
-
89
-
90
-
91
-
92
-
93
-
94
-
95
-
96
-
97
-
98
-
99
-
100
-
101
-
102
-
103
-
104
-
105
-
106
-
107
-
108
-
109
-
110
-
111
-
112
-
113
-
114
-
115
-
116
-
117
-
118
-
119
-
120
-
121
-
122
-
123
-
124
-
125
-
126
-
127
-
128
-
129
-
130
-
131
-
132
-
133
-
134
-
135
-
136
-
137
-
138
-
139
-
140
-
141
-
142
-
143
-
144
-
145
-
146
-
147
-
148
-
149
-
150
-
151
-
152
-
153
-
154
 |
 |
74 BANK OF AMERICA 2004
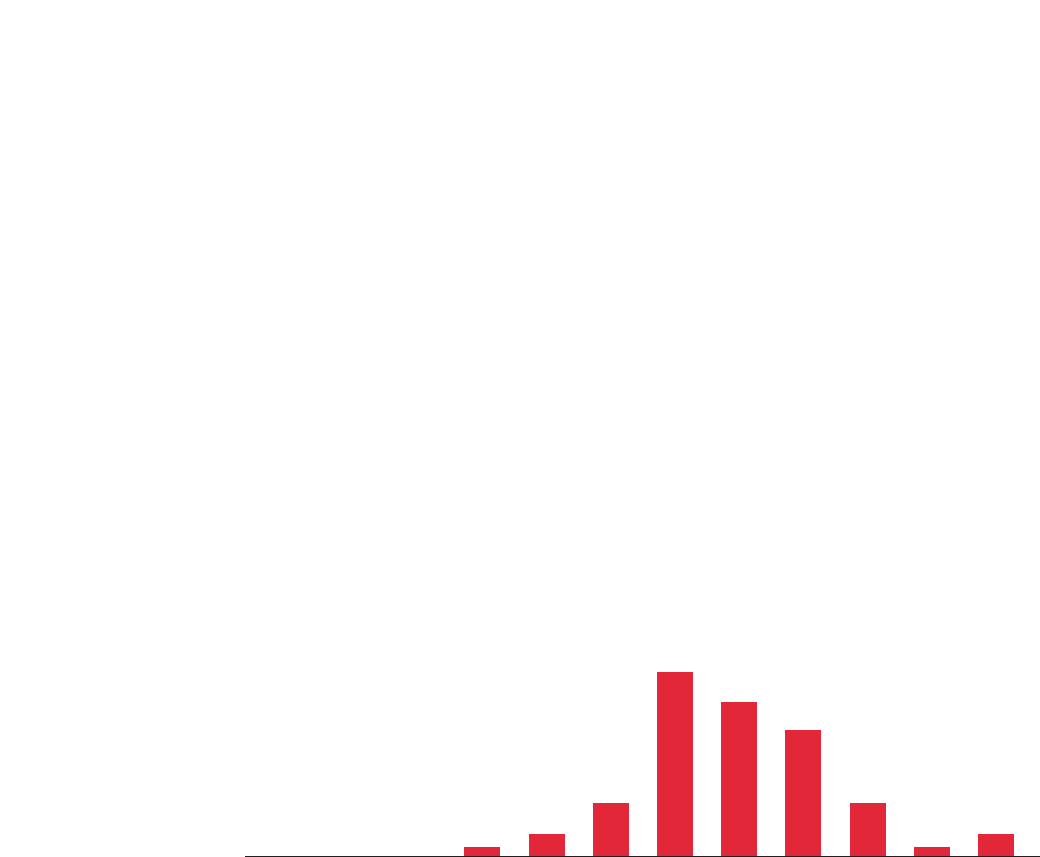
The above histogram does not include two losses greater than
$50 million associated with MSRs as the losses were related to
model changes rather than market changes in the portfolio. For
additional information on MSRs, see Notes 1 and 8 of the
Consolidated Financial Statements.
To evaluate risk in our trading activities, we focus on the actual
and potential volatility of individual positions as well as portfolios. At
a portfolio and corporate level, we use Value-at-Risk (VAR) modeling
and stress testing. VAR is a key statistic used to measure and man-
age market risk. Trading limits and VAR are used to manage day-to-
day risks and are subject to testing where we compare expected
performance to actual performance. This testing provides us a view
of our models’ predictive accuracy. All limit excesses are communicated
to senior management for review.
A VAR model estimates a range of hypothetical scenarios within
which the next day’s profit or loss is expected. These estimates are
impacted by the nature of the positions in the portfolio and the cor-
relation within the portfolio. Within any VAR model, there are signifi-
cant and numerous assumptions that will differ from company to
company. Our VAR model assumes a 99 percent confidence level.
Statistically this means that losses will exceed VAR, on average, one
out of 100 trading days, or two to three times each year.
In addition to reviewing our underlying model assumptions with
senior management, we seek to mitigate the uncertainties related to
these assumptions and estimates through close monitoring and by
updating the assumptions and estimates on an ongoing basis. If the
results of our analysis indicate higher than expected levels of risk,
proactive measures are taken to adjust risk levels.
Trading Risk Management
Trading-related revenues represent the amount earned from our trading
positions, which include trading account assets and liabilities, as well
as derivative positions and, prior to the conversion of the Certificates
into MSRs, market value adjustments to the Certificates and the
MSRs. Trading positions are taken in a diverse range of financial
instruments and markets. Trading account assets and liabilities, and
derivative positions are reported at fair value. MSRs are reported at
lower of cost or market. For more information on fair value, see
Complex Accounting Estimates beginning on page 78. For additional
information on MSRs, see Notes 1 and 8 of the Consolidated
Financial Statements. Trading Account Profits represent the net
amount earned from our trading positions and, as reported in the
Consolidated Statement of Income, do not include the Net Interest
Income recognized on trading positions, or the related funding charge
or benefit. Trading Account Profits can be volatile and are largely
driven by general market conditions and customer demand. Trading
Account Profits are dependent on the volume and type of transactions,
the level of risk assumed, and the volatility of price and rate movements
at any given time within the ever-changing market environment.
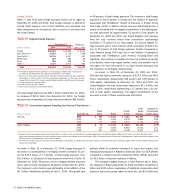
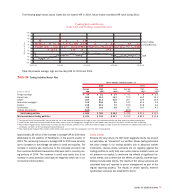
The histogram of daily revenue or loss below is a graphic
depiction of trading volatility and illustrates the level of trading-
related revenue for 2004. Trading-related revenue encompasses both
proprietary trading and customer-related activities. In 2004, positive
trading-related revenue was recorded for 87 percent of trading days.
Furthermore, only five percent of the total trading days had losses
greater than $10 million, and the largest loss was $27 million. This
can be compared to 2003 and 2002 as follows:
•In 2003, positive trading-related revenue was recorded for 88
percent of trading days and only four percent of total trading
days had losses greater than $10 million, and the largest loss
was $41 million.
•In 2002, positive trading-related revenue was recorded for 86
percent of trading days and only five percent of total trading
days had losses greater than $10 million, and the largest loss
was $32 million.
Revenue
Number of Days
(Dollars in millions)
Histogram of Daily Trading-related Revenue
Twelve Months Ended December 31, 2004
< -50 -50 to -40 -40 to -30 -30 to -20 -20 to -10 -10 to 0 0 to 10 10 to 20 20 to 30 30 to 40 40 to 50 > 50
0
30
60
80
70
50
40
20
10