Bank of America 2004 Annual Report Download - page 31
Download and view the complete annual report
Please find page 31 of the 2004 Bank of America annual report below. You can navigate through the pages in the report by either clicking on the pages listed below, or by using the keyword search tool below to find specific information within the annual report.-
 1
1 -
2
-
3
-
4
-
5
-
6
-
7
-
8
-
9
-
10
-
11
-
12
-
13
-
14
-
15
-
16
-
17
-
18
-
19
-
20
-
 21
21 -
 22
22 -
 23
23 -
 24
24 -
 25
25 -
 26
26 -
 27
27 -
 28
28 -
 29
29 -
 30
30 -
 31
31 -
 32
32 -
 33
33 -
 34
34 -
 35
35 -
 36
36 -
 37
37 -
 38
38 -
 39
39 -
 40
40 -
 41
41 -
42
-
43
-
44
-
45
-
46
-
47
-
48
-
49
-
50
-
51
-
52
-
53
-
54
-
55
-
56
-
57
-
58
-
59
-
60
-
61
-
62
-
63
-
64
-
65
-
66
-
67
-
68
-
69
-
70
-
71
-
72
-
73
-
74
-
75
-
76
-
77
-
78
-
79
-
80
-
81
-
82
-
83
-
84
-
85
-
86
-
87
-
88
-
89
-
90
-
91
-
92
-
93
-
94
-
95
-
96
-
97
-
98
-
99
-
100
-
101
-
102
-
103
-
104
-
105
-
106
-
107
-
108
-
109
-
110
-
111
-
112
-
113
-
114
-
115
-
116
-
117
-
118
-
119
-
120
-
121
-
122
-
123
-
124
-
125
-
126
-
127
-
128
-
129
-
130
-
131
-
132
-
133
-
134
-
135
-
136
-
137
-
138
-
139
-
140
-
141
-
142
-
143
-
144
-
145
-
146
-
147
-
148
-
149
-
150
-
151
-
152
-
153
-
154
 |
 |

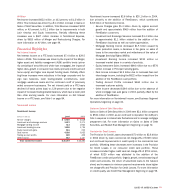
BANK OF AMERICA IN 2004 EARNED A RECORD $14.1 BILLION,
making the company the fifth most profitable in the world.
Earnings were up 31% from a year earlier, due to
the addition of FleetBoston Financial Corporation, which
was acquired on April 1, 2004, and the company’s contin-
uing business momentum throughout the franchise.
Under purchase accounting rules, Fleet’s impact prior to
April 1, 2004, is not included in the financial results.
On a pro forma basis, if Fleet’s previous results
were included, net income was up 12% for the year.
Diluted earnings per share of $3.69 were up from
$3.57 in 2003. Return on equity in 2004 was 16.8%.
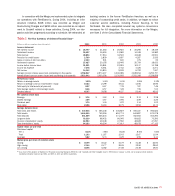
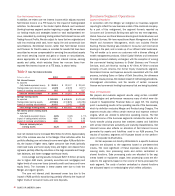
Revenue
Fully taxable-equivalent revenue grew 29% to $49.6
billion from $38.6 billion in 2003.
Fully taxable-equivalent net interest income rose
34% to $29.5 billion. In addition to the impact of Fleet, the
increase was driven by the results of asset-liability man-
agement activities, higher consumer loan levels and
higher core deposit levels, partially offset by reductions
in large corporate and foreign loan portfolios as well as
lower trading-related contributions and mortgage ware-
house levels.
Noninterest income grew 22% to $20.1 billion,
driven by the impact of Fleet and the growth of card
income, service charges, investment and brokerage fees,
equity investment gains, trading account profits and
investment banking income. This was partially offset by
lower mortgage banking income.
Securities gains were $2.12 billion, compared to
$941 million a year ago.
Efficiency
Noninterest expense grew 34% to $27 billion, driven by the
impact of Fleet, merger and restructuring costs, higher
personnel costs, revenue-related incentive compensation
and increased occupancy, marketing, and litigation-
related expense. The efficiency ratio was 54.5%.
Credit quality
All major commercial asset quality indicators showed
positive trends throughout the year. The credit card pro-
vision grew as a result of card portfolio growth, the return
of previously securitized loans to the balance sheet and
increases in minimum payment requirements. Consumer
asset quality remained strong in all other categories.
Provision expense was $2.77 billion in 2004, a 2%
decline from 2003 despite the addition of Fleet. Net
charge-offs totaled $3.11 billion, or 0.66% of loans and
leases, compared to $3.11 billion, or 0.87% of loans and
leases in 2003.
30 BANK OF AMERICA 2004
Bank of America Earns Record
$14.1 Billion in 2004
Business momentum, Fleet merger drive 31% net income gain.