Bank of America 2004 Annual Report Download - page 135
Download and view the complete annual report
Please find page 135 of the 2004 Bank of America annual report below. You can navigate through the pages in the report by either clicking on the pages listed below, or by using the keyword search tool below to find specific information within the annual report.-
 1
1 -
2
-
3
-
4
-
5
-
6
-
7
-
8
-
9
-
10
-
11
-
12
-
13
-
14
-
15
-
16
-
17
-
18
-
19
-
20
-
21
-
22
-
23
-
24
-
25
-
26
-
27
-
28
-
29
-
30
-
31
-
32
-
33
-
34
-
35
-
36
-
37
-
38
-
39
-
40
-
41
-
42
-
43
-
44
-
45
-
46
-
47
-
48
-
49
-
50
-
51
-
52
-
53
-
54
-
55
-
56
-
57
-
58
-
59
-
60
-
61
-
62
-
63
-
64
-
65
-
66
-
67
-
68
-
69
-
70
-
71
-
72
-
73
-
74
-
75
-
76
-
77
-
78
-
79
-
80
-
81
-
82
-
83
-
84
-
85
-
86
-
87
-
88
-
89
-
90
-
91
-
92
-
93
-
94
-
95
-
96
-
97
-
98
-
99
-
100
-
101
-
102
-
103
-
104
-
105
-
106
-
107
-
108
-
109
-
110
-
111
-
112
-
113
-
114
-
115
-
116
-
117
-
118
-
119
-
120
-
121
-
122
-
123
-
124
-
 125
125 -
 126
126 -
 127
127 -
 128
128 -
 129
129 -
 130
130 -
 131
131 -
 132
132 -
 133
133 -
 134
134 -
 135
135 -
 136
136 -
 137
137 -
 138
138 -
 139
139 -
 140
140 -
 141
141 -
 142
142 -
 143
143 -
 144
144 -
 145
145 -
146
-
147
-
148
-
149
-
150
-
151
-
152
-
153
-
154
 |
 |

134 BANK OF AMERICA 2004
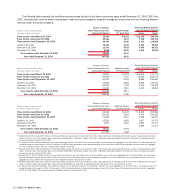
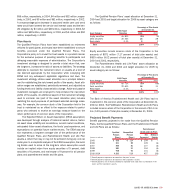
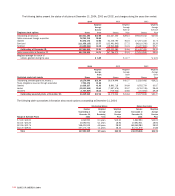
The calculation of earnings per common share and diluted earnings
per common share for 2004, 2003 and 2002 is presented below.
See Note 1 of the Consolidated Financial Statements for a discus-
sion on the calculation of earnings per common share.
(Dollars in millions,
except per share information;
shares in thousands) 2004 2003 2002
Earnings per common share
Net income $ 14,143 $ 10,810 $ 9,249
Preferred stock dividends (16) (4) (5)
Net income available to
common shareholders $ 14,127 $ 10,806 $ 9,244
Average common shares
issued and outstanding 3,758,507 2,973,407 3,040,085
Earnings per common share $ 3.76 $ 3.63 $ 3.04
Diluted earnings per
common share
Net income available to
common shareholders $ 14,127 $ 10,806 $ 9,244
Convertible preferred
stock dividends 245
Net income available to
common shareholders and
assumed conversions $ 14,129 $ 10,810 $ 9,249
Average common shares
issued and outstanding 3,758,507 2,973,407 3,040,085
Dilutive potential
common shares(1,2) 65,436 56,949 90,850
Total diluted average common
shares issued and outstanding 3,823,943 3,030,356 3,130,935
Diluted earnings per
common share $ 3.69 $ 3.57 $ 2.95
(1) For 2004, 2003 and 2002, average options to purchase 10 million, 19 million and 45 million
shares, respectively, were outstanding but not included in the computation of earnings per
common share because they were antidilutive.
(2) Includes incremental shares from assumed conversions of convertible preferred stock,
restricted stock units, restricted stock shares and stock options.
Note 14
Regulatory Requirements and Restrictions
The Board of Governors of the Federal Reserve System (FRB) requires
the Corporation’s banking subsidiaries to maintain reserve balances
based on a percentage of certain deposits. Average daily reserve bal-
ances required by the FRB were $6.9 billion and $4.1 billion for 2004
and 2003, respectively. Currency and coin residing in branches and
cash vaults (vault cash) are used to partially satisfy the reserve
requirement. The average daily reserve balances, in excess of vault
cash, held with the Federal Reserve Bank amounted to $70 million
and $317 million for 2004 and 2003, respectively.
The primary source of funds for cash distributions by the
Corporation to its shareholders is dividends received from its bank-
ing subsidiaries. Bank of America, N.A. and Fleet National Bank
declared and paid dividends of $5.9 billion and $1.3 billion, respec-
tively, for 2004 to the parent. In 2005, Bank of America, N.A. and
Fleet National Bank can declare and pay dividends to the parent of
$4.7 billion and $790 million plus an additional amount equal to their
net profits for 2005, as defined by statute, up to the date of any such
dividend declaration. The other subsidiary national banks can initiate
aggregate dividend payments in 2005 of $2.6 billion plus an addi-
tional amount equal to their net profits for 2005, as defined by
statute, up to the date of any such dividend declaration. The amount
of dividends that each subsidiary bank may declare in a calendar year
without approval by the OCC is the subsidiary bank’s net profits for
that year combined with its net retained profits, as defined, for the
preceding two years.
The FRB, the OCC and the Federal Deposit Insurance
Corporation (collectively, the Agencies) have issued regulatory capital
guidelines for U.S. banking organizations. Failure to meet the capital
requirements can initiate certain mandatory and discretionary
actions by regulators that could have a material effect on the
Corporation’s financial statements. At December 31, 2004 and
2003, the Corporation and Bank of America, N.A. were classified as
well-capitalized under this regulatory framework. At December 31,
2004, Fleet National Bank was classified as well-capitalized under
this regulatory framework. There have been no conditions or events
since December 31, 2004 that management believes have changed
the Corporation’s, Bank of America, N.A.’s or Fleet National Bank’s
capital classifications.