Bank of America 2004 Annual Report Download - page 77
Download and view the complete annual report
Please find page 77 of the 2004 Bank of America annual report below. You can navigate through the pages in the report by either clicking on the pages listed below, or by using the keyword search tool below to find specific information within the annual report.-
 1
1 -
2
-
3
-
4
-
5
-
6
-
7
-
8
-
9
-
10
-
11
-
12
-
13
-
14
-
15
-
16
-
17
-
18
-
19
-
20
-
21
-
22
-
23
-
24
-
25
-
26
-
27
-
28
-
29
-
30
-
31
-
32
-
33
-
34
-
35
-
36
-
37
-
38
-
39
-
40
-
41
-
42
-
43
-
44
-
45
-
46
-
47
-
48
-
49
-
50
-
51
-
52
-
53
-
54
-
55
-
56
-
57
-
58
-
59
-
60
-
61
-
62
-
63
-
64
-
65
-
66
-
 67
67 -
 68
68 -
 69
69 -
 70
70 -
 71
71 -
 72
72 -
 73
73 -
 74
74 -
 75
75 -
 76
76 -
 77
77 -
 78
78 -
 79
79 -
 80
80 -
 81
81 -
 82
82 -
 83
83 -
 84
84 -
 85
85 -
 86
86 -
 87
87 -
88
-
89
-
90
-
91
-
92
-
93
-
94
-
95
-
96
-
97
-
98
-
99
-
100
-
101
-
102
-
103
-
104
-
105
-
106
-
107
-
108
-
109
-
110
-
111
-
112
-
113
-
114
-
115
-
116
-
117
-
118
-
119
-
120
-
121
-
122
-
123
-
124
-
125
-
126
-
127
-
128
-
129
-
130
-
131
-
132
-
133
-
134
-
135
-
136
-
137
-
138
-
139
-
140
-
141
-
142
-
143
-
144
-
145
-
146
-
147
-
148
-
149
-
150
-
151
-
152
-
153
-
154
 |
 |

76 BANK OF AMERICA 2004
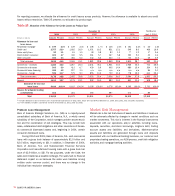
Interest Rate Risk Management
Interest rate risk represents the most significant market risk exposure
to our nontrading financial instruments. Our overall goal is to manage
interest rate sensitivity so that movements in interest rates do not
adversely affect Net Interest Income. Interest rate risk is measured
as the potential volatility in our Net Interest Income caused by
changes in market interest rates. Client facing activities, primarily
lending and deposit-taking, create interest rate sensitive positions on
our Balance Sheet. Interest rate risk from these activities as well as
the impact of ever-changing market conditions, is mitigated using the
ALM process.
Sensitivity simulations are used to estimate the impact on Net
Interest Income of numerous interest rate scenarios, balance sheet
trends and strategies. These simulations estimate levels of short-
term financial instruments, debt securities, loans, deposits, borrow-
ings and derivative instruments. In addition, these simulations
incorporate assumptions about balance sheet dynamics such as loan
and deposit growth and pricing, changes in funding mix, and asset
and liability repricing and maturity characteristics. In addition to Net
Interest Income sensitivity simulations, market value sensitivity
measures are also utilized.
The Balance Sheet Management group maintains a Net Interest
Income forecast utilizing different rate scenarios, with the base case
utilizing the forward market curve. The Balance Sheet Management
group constantly updates the Net Interest Income forecast for chang-
ing assumptions and differing outlooks based on economic trends
and market conditions.
The Balance Sheet Management group reviews the impact on
Net Interest Income of parallel and nonparallel shifts in the yield curve
over different time horizons. The overall interest rate risk position and
strategies are reviewed on an ongoing basis with ALCO. At December
31, 2004, we remain positioned for future rising interest rates and
curve flattening to the extent implied by the forward market curve.
The estimated impact to Net Interest Income over the subse-
quent year from December 31, 2004, resulting from a 100 bp grad-
ual (over 12 months) parallel increase or decrease in interest rates
from the forward market curve calculated as of December 31, 2004
was (1.5) percent and 0.5 percent, respectively. The estimated
impact to Net Interest Income over the subsequent year from
December 31, 2003, resulting from a 100 bp gradual (over 12
months) parallel increase or decrease in interest rates from the for-
ward market curve calculated as of December 31, 2003, was (1.1)
percent and 1.2 percent, respectively.
As part of the ALM process, we use securities, residential
mortgages, and interest rate and foreign exchange derivatives in
managing interest rate sensitivity.
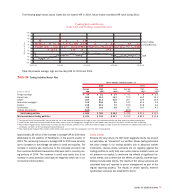
Securities
The securities portfolio is integral to our ALM process. The decision
to purchase or sell securities is based upon the current assessment
of economic and financial conditions, including the interest rate envi-
ronment, liquidity and regulatory requirements, and the relative mix of
our cash and derivative positions. During 2004 and 2003, we pur-
chased securities of $232.6 billion and $195.9 billion, respectively,
sold $105.0 billion and $171.5 billion, respectively, and received pay-
downs of $31.8 billion and $27.2 billion, respectively. Not included in
the purchases above were $46.7 billion of forward purchase con-
tracts of both mortgage-backed securities and mortgage loans at
December 31, 2004 settling from January 2005 to February 2005
with an average yield of 5.26 percent, and $65.2 billion of forward
purchase contracts of both mortgage-backed securities and mort-
gage loans at December 31, 2003 that settled from January 2004 to
February 2004 with an average yield of 5.79 percent. There were also
$25.8 billion of forward sale contracts of mortgage-backed securities
at December 31, 2004 settling from January 2005 to February 2005
with an average yield of 5.47 percent compared to $8.0 billion at
December 31, 2003 that settled in February 2004 with an average
yield of 6.14 percent. These forward purchase and sale contracts
were accounted for as derivatives and designated as cash flow
hedges with their net-of-tax unrealized gains and losses included in
Accumulated Other Comprehensive Income (OCI). For additional infor-
mation on derivatives designated as cash flow hedges, see Note 4 of
the Consolidated Financial Statements. The forward purchase and
sale contracts at December 31, 2004 and 2003 were also included in
Table
IV
on pages 88 and 89. During the year, we continuously moni-
tored the interest rate risk position of the portfolio and repositioned
the securities portfolio in order to manage prepayment risk and to take
advantage of interest rate fluctuations. Through sales in the securities
portfolio, we realized $2.1 billion and $941 million in Gains on Sales
of Debt Securities in 2004 and 2003, respectively.