Bank of America 2004 Annual Report Download - page 92
Download and view the complete annual report
Please find page 92 of the 2004 Bank of America annual report below. You can navigate through the pages in the report by either clicking on the pages listed below, or by using the keyword search tool below to find specific information within the annual report.-
 1
1 -
2
-
3
-
4
-
5
-
6
-
7
-
8
-
9
-
10
-
11
-
12
-
13
-
14
-
15
-
16
-
17
-
18
-
19
-
20
-
21
-
22
-
23
-
24
-
25
-
26
-
27
-
28
-
29
-
30
-
31
-
32
-
33
-
34
-
35
-
36
-
37
-
38
-
39
-
40
-
41
-
42
-
43
-
44
-
45
-
46
-
47
-
48
-
49
-
50
-
51
-
52
-
53
-
54
-
55
-
56
-
57
-
58
-
59
-
60
-
61
-
62
-
63
-
64
-
65
-
66
-
67
-
68
-
69
-
70
-
71
-
72
-
73
-
74
-
75
-
76
-
77
-
78
-
79
-
80
-
81
-
 82
82 -
 83
83 -
 84
84 -
 85
85 -
 86
86 -
 87
87 -
 88
88 -
 89
89 -
 90
90 -
 91
91 -
 92
92 -
 93
93 -
 94
94 -
 95
95 -
 96
96 -
 97
97 -
 98
98 -
 99
99 -
 100
100 -
 101
101 -
 102
102 -
103
-
104
-
105
-
106
-
107
-
108
-
109
-
110
-
111
-
112
-
113
-
114
-
115
-
116
-
117
-
118
-
119
-
120
-
121
-
122
-
123
-
124
-
125
-
126
-
127
-
128
-
129
-
130
-
131
-
132
-
133
-
134
-
135
-
136
-
137
-
138
-
139
-
140
-
141
-
142
-
143
-
144
-
145
-
146
-
147
-
148
-
149
-
150
-
151
-
152
-
153
-
154
 |
 |

BANK OF AMERICA 2004 91
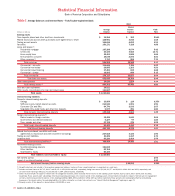
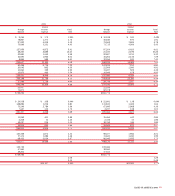
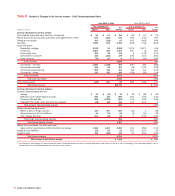
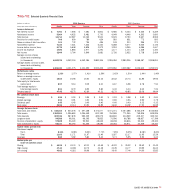
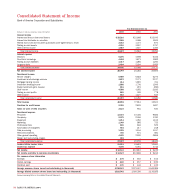
Table VII
Selected Quarterly Financial Data
(Dollars in millions, 2004 Quarters 2003 Quarters
except per share information) Fourth Third Second First Fourth Third Second First
Income statement
Net interest income $ 7,750 $ 7,665 $ 7,581 $ 5,801 $ 5,586 $ 5,304 $ 5,365 $ 5,209
Noninterest income 5,964 4,922 5,481 3,730 4,049 4,446 4,262 3,693
Total revenue 13,714 12,587 13,062 9,531 9,635 9,750 9,627 8,902
Provision for credit losses 706 650 789 624 583 651 772 833
Gains on sales of debt securities 101 732 795 495 139 233 296 273
Noninterest expense 7,334 7,021 7,242 5,430 5,288 5,077 5,065 4,725
Income before income taxes 5,775 5,648 5,826 3,972 3,903 4,255 4,086 3,617
Income tax expense 1,926 1,884 1,977 1,291 1,177 1,333 1,348 1,193
Net income 3,849 3,764 3,849 2,681 2,726 2,922 2,738 2,424
Average common shares
issued and outstanding
(in thousands) 4,032,979 4,052,304 4,062,384 2,880,306 2,926,494 2,980,206 2,988,187 2,998,811
Average diluted common shares
issued and outstanding
(in thousands) 4,106,040 4,121,375 4,131,290 2,933,402 2,978,962 3,039,282 3,046,612 3,052,576
Performance ratios
Return on average assets 1.33% 1.37% 1.41% 1.29% 1.42% 1.50% 1.44% 1.40%
Return on average common
shareholders’ equity 15.63 15.56 16.63 22.16 22.42 23.74 21.86 19.92
Total equity to total assets
(period end) 8.97 9.14 9.35 6.10 6.67 6.98 6.78 7.51
Total average equity to
total average assets 8.51 8.79 8.52 5.84 6.32 6.34 6.62 7.06
Dividend payout 47.45 48.75 42.60 43.21 42.70 40.85 35.06 39.64
Per common share data
Earnings $ 0.95 $ 0.93 $ 0.95 $ 0.93 $ 0.93 $ 0.98 $ 0.92 $ 0.81
Diluted earnings 0.94 0.91 0.93 0.91 0.92 0.96 0.90 0.79
Dividends paid 0.45 0.45 0.40 0.40 0.40 0.40 0.32 0.32
Book value 24.56 24.14 23.51 16.85 16.63 16.92 17.03 16.69
Average balance sheet
Total loans and leases $ 515,463 $ 503,078 $ 497,158 $ 374,077 $ 371,071 $ 357,288 $ 350,279 $ 345,662
Total assets 1,152,551 1,096,683 1,094,459 833,192 764,186 771,255 759,906 699,926
Total deposits 609,936 587,878 582,305 425,075 418,840 414,569 405,307 385,760
Long-term debt 99,588 98,361 96,395 78,852 70,596 66,788 68,927 67,399
Common shareholders’ equity 97,828 96,120 92,943 48,632 48,238 48,816 50,212 49,343
Total shareholders’ equity 98,100 96,392 93,266 48,686 48,293 48,871 50,269 49,400
Capital ratios (period end)
Risk-based capital:
Tier 1 8.10% 8.08% 8.20% 7.73% 7.85% 8.25% 8.08% 8.20%
Total 11.63 11.71 11.97 11.46 11.87 12.17 11.95 12.29
Leverage 5.82 5.92 5.83 5.43 5.73 5.95 5.92 6.24
Market price per
share of common stock
Closing $ 46.99 $ 43.33 $ 42.31 $ 40.49 $ 40.22 $ 39.02 $ 39.52 $ 33.42
High closing 47.44 44.98 42.72 41.38 41.25 41.77 39.95 36.24
Low closing 43.62 41.81 38.96 39.15 36.43 37.44 34.00 32.82