Bank of America 2004 Annual Report Download - page 44
Download and view the complete annual report
Please find page 44 of the 2004 Bank of America annual report below. You can navigate through the pages in the report by either clicking on the pages listed below, or by using the keyword search tool below to find specific information within the annual report.-
 1
1 -
2
-
3
-
4
-
5
-
6
-
7
-
8
-
9
-
10
-
11
-
12
-
13
-
14
-
15
-
16
-
17
-
18
-
19
-
20
-
21
-
22
-
23
-
24
-
25
-
26
-
27
-
28
-
29
-
30
-
31
-
32
-
33
-
 34
34 -
 35
35 -
 36
36 -
 37
37 -
 38
38 -
 39
39 -
 40
40 -
 41
41 -
 42
42 -
 43
43 -
 44
44 -
 45
45 -
 46
46 -
 47
47 -
 48
48 -
 49
49 -
 50
50 -
 51
51 -
 52
52 -
 53
53 -
 54
54 -
55
-
56
-
57
-
58
-
59
-
60
-
61
-
62
-
63
-
64
-
65
-
66
-
67
-
68
-
69
-
70
-
71
-
72
-
73
-
74
-
75
-
76
-
77
-
78
-
79
-
80
-
81
-
82
-
83
-
84
-
85
-
86
-
87
-
88
-
89
-
90
-
91
-
92
-
93
-
94
-
95
-
96
-
97
-
98
-
99
-
100
-
101
-
102
-
103
-
104
-
105
-
106
-
107
-
108
-
109
-
110
-
111
-
112
-
113
-
114
-
115
-
116
-
117
-
118
-
119
-
120
-
121
-
122
-
123
-
124
-
125
-
126
-
127
-
128
-
129
-
130
-
131
-
132
-
133
-
134
-
135
-
136
-
137
-
138
-
139
-
140
-
141
-
142
-
143
-
144
-
145
-
146
-
147
-
148
-
149
-
150
-
151
-
152
-
153
-
154
 |
 |

BANK OF AMERICA 2004 43
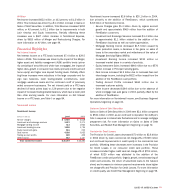
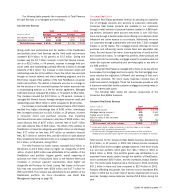
The following table presents the components of Total Revenue
for Card Services on a managed and held basis.
Card Services Revenue
2004 2003
(Dollars in millions) Managed Held Managed Held
Net interest income $ 5,079 $4,236 $ 2,856 $ 2,537
Noninterest income 3,061 3,246 1,930 2,065
Total card services revenue $ 8,140 $7,482 $ 4,786 $ 4,602
Strong credit card performance and the addition of the FleetBoston
card portfolio drove Card Services results. Held credit card revenue
increased $2.9 billion, or 63 percent, to $7.5 billion. Driving this
increase was the $1.7 billion increase in held Net Interest Income,
due to a $15.2 billion, or 54 percent, increase in average held con-
sumer credit card outstandings, partially offset by a decline in average
Deposits of $3.3 billion. The increase in held consumer credit card
outstandings was due to the addition of over five million new accounts
through our branch network and direct marketing programs, and the
$5.0 billion impact of the addition of the held FleetBoston consumer
credit card portfolio. The decline in Deposits was due to a change in
the fee structure in the merchant business for certain accounts from
a compensating balance to a fee for service agreement. Managed
credit card revenue increased $3.4 billion, or 70 percent, to $8.1 billion.
This increase included the $2.2 billion, or 78 percent, increase in
managed Net Interest Income. Average managed consumer credit card
outstandings were $50.3 billion in 2004 compared to $31.6 billion.
The increase in held credit card Noninterest Income of $1.2 billion
resulted from higher interchange fees of $381 million. Interchange
fees increased mainly due to a $21.4 billion, or 38 percent, increase
in consumer credit card purchase volumes. Also impacting
Noninterest Income were increases in late fees of $238 million, mer-
chant discount fees of $197 million, overlimit fees of $107 million
and cash advance fees of $64 million. The effect of the addition of
FleetBoston on these fee categories was $169 million on interchange
fees, $77 million on late fees, $47 million on merchant discount
fees, $37 million on overlimit fees, and $24 million on cash advance
fees, respectively. Noninterest Income on a managed basis increased
$1.1 billion, or 59 percent, during 2004.
The held Provision for Credit Losses increased $1.2 billion, or
68 percent, to $3.0 billion driven by higher net charge-offs of $791
million, of which $320 million was attributable to the addition of the
FleetBoston card portfolio. Organic growth, overall seasoning of
accounts, the return of securitized loans to the balance sheet and
increases in minimum payment requirements drove higher net
charge-offs and Provision for Credit Losses. Net losses on the port-
folio that was securitized were $524 million and $177 million for
2004 and 2003. The increase was attributable to the addition of the
FleetBoston portfolio. For more information, see Credit Risk
Management beginning on page 58.
Consumer Real Estate
Consumer Real Estate generates revenue by providing an extensive
line of mortgage products and services to customers nationwide.
Consumer Real Estate products are available to our customers
through a retail network of personal bankers located in 5,885 bank-
ing centers, dedicated sales account executives in over 190 loca-
tions and through a devoted sales force offering our customers direct
telephone and online access to our products. Additionally, we serve
our customers through a partnership with more than 7,200 mortgage
brokers in all 50 states. The mortgage product offerings for home
purchase and refinancing needs include fixed and adjustable rate
loans, first and second lien loans, home equity lines of credit, and lot
and construction loans. To manage this portfolio, these products are
either sold into the secondary mortgage market to investors while we
retain the customer relationship and servicing rights or are held in
our ALM portfolio.
Consumer Real Estate is managed with a focus on its two primary
businesses, first mortgage and home equity. The first mortgage busi-
ness includes the origination, fulfillment and servicing of first mort-
gage loan products. The home equity business includes lines of
credit and second mortgages. These two businesses provide us with
a business model that meets customer mortgage borrowing needs in
various interest rate cycles.
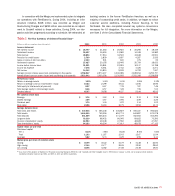
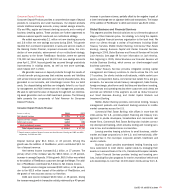
The following table shows the revenue components of the
Consumer Real Estate business.
Consumer Real Estate Revenue
(Dollars in millions) 2004 2003
Net interest income $ 2,224 $ 1,795
Mortgage banking income(1,2) 595 2,140
Trading account profits (349) (159)
Gains on sales of debt securities 117 –
Other income 61 96
Total consumer real estate revenue $ 2,648 $ 3,872
(1) Includes gains related to hedge ineffectiveness of cash flow hedges on our mortgage
warehouse of $117 and $38 for 2004 and 2003.
(2) For 2004 and 2003, Mortgage Banking Income included revenue of $181 and $218 for
mortgage services provided to other segments that are eliminated in consolidation (in All Other).
Total revenue for the Consumer Real Estate business decreased by
$1.2 billion, or 32 percent, in 2004. Net Interest Income increased
by $429 million driven by higher average balances in the home equity
line and loan portfolio, which grew from $21.7 billion in 2003 to
$39.0 billion in 2004. This portfolio growth was attributable to an
expanded home equity market through the addition of FleetBoston,
which contributed $18.5 billion, and the increased product distribu-
tion. The home equity business had a record year in 2004, producing
$57.1 billion in loans and lines compared to $23.4 billion in 2003.
Partially offsetting this growth, Net Interest Income decreased $90
million in 2004 due to a lower level of escrow deposits held on loans
serviced. Average escrow balances declined $2.8 billion during the
year.