Bank of America 2004 Annual Report Download - page 68
Download and view the complete annual report
Please find page 68 of the 2004 Bank of America annual report below. You can navigate through the pages in the report by either clicking on the pages listed below, or by using the keyword search tool below to find specific information within the annual report.-
 1
1 -
2
-
3
-
4
-
5
-
6
-
7
-
8
-
9
-
10
-
11
-
12
-
13
-
14
-
15
-
16
-
17
-
18
-
19
-
20
-
21
-
22
-
23
-
24
-
25
-
26
-
27
-
28
-
29
-
30
-
31
-
32
-
33
-
34
-
35
-
36
-
37
-
38
-
39
-
40
-
41
-
42
-
43
-
44
-
45
-
46
-
47
-
48
-
49
-
50
-
51
-
52
-
53
-
54
-
55
-
56
-
57
-
 58
58 -
 59
59 -
 60
60 -
 61
61 -
 62
62 -
 63
63 -
 64
64 -
 65
65 -
 66
66 -
 67
67 -
 68
68 -
 69
69 -
 70
70 -
 71
71 -
 72
72 -
 73
73 -
 74
74 -
 75
75 -
 76
76 -
 77
77 -
 78
78 -
79
-
80
-
81
-
82
-
83
-
84
-
85
-
86
-
87
-
88
-
89
-
90
-
91
-
92
-
93
-
94
-
95
-
96
-
97
-
98
-
99
-
100
-
101
-
102
-
103
-
104
-
105
-
106
-
107
-
108
-
109
-
110
-
111
-
112
-
113
-
114
-
115
-
116
-
117
-
118
-
119
-
120
-
121
-
122
-
123
-
124
-
125
-
126
-
127
-
128
-
129
-
130
-
131
-
132
-
133
-
134
-
135
-
136
-
137
-
138
-
139
-
140
-
141
-
142
-
143
-
144
-
145
-
146
-
147
-
148
-
149
-
150
-
151
-
152
-
153
-
154
 |
 |

BANK OF AMERICA 2004 67
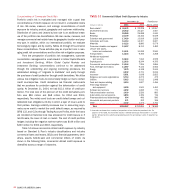
We routinely review the loan and lease portfolio to determine if any
credit exposure should be placed on nonperforming status. An asset
is placed on nonperforming status when it is determined that full col-
lection of principal and/or interest in accordance with its contractual
terms is not probable. As presented in Table 21, nonperforming com-
mercial assets decreased $654 million to $1.6 billion at December
31, 2004 due primarily to the $760 million decrease in the nonper-
forming commercial loans and leases despite the addition of the
$944 million FleetBoston nonperforming commercial loans and
leases at April 1, 2004. The decrease in 2004 was centered in Latin
America, Global Capital Markets and Investment Banking and Global
Business and Financial Services. These businesses combined to
reduce nonperforming commercial loans and leases by $566 million
during 2004, despite the addition of the FleetBoston commercial non-
performing loan and lease balance of $874 million on April 1, 2004,
related to these businesses. The decreases in total nonperforming
commercial loans and leases resulted from paydowns and payoffs of
$1.4 billion, charge-offs of $640 million, loan sales of $515 million
and returns to performing status of $348 million, partially offset by
new nonaccrual loan inflows of $1.3 billion and the addition of
nonperforming loans and leases from the FleetBoston portfolio.
Increased levels of paydowns and payoffs compared to 2003 resulted
from the improvement in credit quality experienced in 2004.
Nonperforming commercial – domestic loans decreased by
$533 million and represented 0.70 percent of commercial – domestic
loans at December 31, 2004 compared to 1.52 percent at December
31, 2003. Nonperforming commercial – foreign loans decreased $311
million and represented 1.45 percent of commercial – foreign loans at
December 31, 2004 compared to 5.37 percent at December 31, 2003.
The improvement in the percentage of nonperforming commercial –
domestic loans to the total commercial – domestic loans was driven
by the growth in commercial – domestic loans and the addition of the
FleetBoston portfolio.
Nonperforming commercial asset sales in 2004 were $601 million,
comprised of $515 million of nonperforming commercial loans, $74
million of commercial foreclosed properties and $12 million of
nonperforming securities. Nonperforming commercial asset sales in
2003 totaled $1.6 billion, comprised of $1.5 billion of nonperforming
commercial loans and $123 million of commercial foreclosed properties.
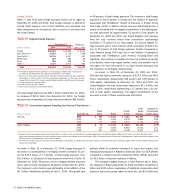
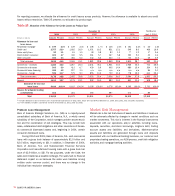
Table 21 presents nonperforming commercial assets for each year in the five-year period ending at December 31, 2004.
Table 21
Nonperforming Commercial Assets(1)
December 31 FleetBoston
(Dollars in millions) 2004 2003 2002 2001 2000 April 1, 2004
■■■■■
Nonperforming commercial loans and leases
Commercial – domestic $ 855 $ 1,388 $ 2,621 $ 2,991 $ 2,715 $ 317
Commercial real estate 87 142 164 243 239 80
Commercial lease financing 266 127 160 134 65 51
Commercial – foreign 267 578 1,359 459 482 496
■■■■■
Total nonperforming commercial loans and leases 1,475 2,235 4,304 3,827 3,501 944
Nonperforming securities(2) 140 ––––135
Commercial foreclosed properties 33 67 126 68 67 13
■■■■■
Total nonperforming commercial assets(3) $ 1,648 $ 2,302 $ 4,430 $ 3,895 $ 3,568 $ 1,092
■■■■■
Nonperforming commercial loans and leases as a percentage of
outstanding commercial loans and leases 0.76% 1.70% 2.96% 2.33% 1.72% 1.53%
Nonperforming commercial assets as a percentage of
outstanding commercial loans, leases and foreclosed properties 0.85 1.75 3.05 2.38 1.75 1.77
■■■■■
(1) In 2004, $111 in Interest Income was estimated to be contractually due on nonperforming commercial loans and leases, and troubled debt restructured loans.
(2) Primarily related to international securities held in the AFS securities portfolio.
(3) Balances do not include $123, $186, $73, $289 and $84 of nonperforming commercial assets, primarily commercial loans held-for-sale included in Other Assets at December 31, 2004, 2003, 2002,
2001 and 2000, respectively.