Bank of America 2004 Annual Report Download - page 64
Download and view the complete annual report
Please find page 64 of the 2004 Bank of America annual report below. You can navigate through the pages in the report by either clicking on the pages listed below, or by using the keyword search tool below to find specific information within the annual report.-
 1
1 -
2
-
3
-
4
-
5
-
6
-
7
-
8
-
9
-
10
-
11
-
12
-
13
-
14
-
15
-
16
-
17
-
18
-
19
-
20
-
21
-
22
-
23
-
24
-
25
-
26
-
27
-
28
-
29
-
30
-
31
-
32
-
33
-
34
-
35
-
36
-
37
-
38
-
39
-
40
-
41
-
42
-
43
-
44
-
45
-
46
-
47
-
48
-
49
-
50
-
51
-
52
-
53
-
 54
54 -
 55
55 -
 56
56 -
 57
57 -
 58
58 -
 59
59 -
 60
60 -
 61
61 -
 62
62 -
 63
63 -
 64
64 -
 65
65 -
 66
66 -
 67
67 -
 68
68 -
 69
69 -
 70
70 -
 71
71 -
 72
72 -
 73
73 -
 74
74 -
75
-
76
-
77
-
78
-
79
-
80
-
81
-
82
-
83
-
84
-
85
-
86
-
87
-
88
-
89
-
90
-
91
-
92
-
93
-
94
-
95
-
96
-
97
-
98
-
99
-
100
-
101
-
102
-
103
-
104
-
105
-
106
-
107
-
108
-
109
-
110
-
111
-
112
-
113
-
114
-
115
-
116
-
117
-
118
-
119
-
120
-
121
-
122
-
123
-
124
-
125
-
126
-
127
-
128
-
129
-
130
-
131
-
132
-
133
-
134
-
135
-
136
-
137
-
138
-
139
-
140
-
141
-
142
-
143
-
144
-
145
-
146
-
147
-
148
-
149
-
150
-
151
-
152
-
153
-
154
 |
 |

BANK OF AMERICA 2004 63
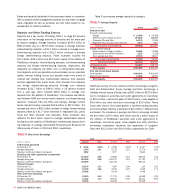
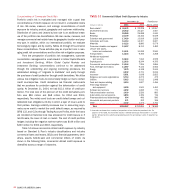
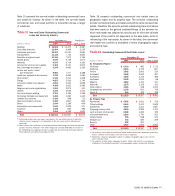
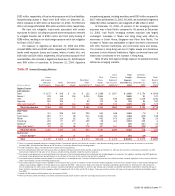
Table 15 presents the non-real estate outstanding commercial loans
and leases by industry. As shown in the table, the non-real estate
commercial loan and lease portfolio is diversified across a range
of industries.
Table 15
Non–real Estate Outstanding Commercial
Loans and Leases by Industry
December 31 FleetBoston
(Dollars in millions) 2004 2003 April 1, 2004
■■■■■
Retailing $ 16,908 $ 11,474 $ 4,287
Diversified financials 12,454 6,469 2,135
Individuals and trusts 12,357 10,510 2,681
Transportation 11,135 7,715 2,806
Education and government 10,134 7,874 1,155
Capital goods 9,673 5,729 4,073
Materials 9,547 5,704 4,191
Commercial services and supplies 9,362 5,701 2,876
Food, beverage and tobacco 9,344 6,942 2,326
Leisure and sports, hotels
and restaurants 8,987 7,477 2,488
Healthcare equipment and services 7,972 4,052 3,460
Real estate(1) 6,140 4,413 3,608
Energy 4,627 2,516 1,740
Consumer durables and apparel 4,564 2,161 2,269
Media 4,468 2,821 2,566
Religious and social organizations 3,951 2,975 431
Utilities 3,274 2,635 1,431
Food and staples retailing 2,701 1,364 1,349
Technology hardware and equipment 2,482 1,260 1,142
Software and services 2,430 948 713
Telecommunication services 2,382 1,967 812
Banks 2,044 1,199 454
Automobiles and components 1,643 1,029 570
Insurance 1,478 840 492
Other(2) 1,554 6,162 1,621
■■■■■
Total $ 161,611 $ 111,937 $ 51,676
■■■■■
(1) Commercial product loans and leases to borrowers in the real estate industry for which the
ultimate source of repayment is not dependent on the sale, lease, rental or refinancing of
real estate.
(2) Other includes loans and leases to the pharmaceutical, biotechnology, household and personal
products industries. Reduction in the Other category was primarily attributable to a revision in
the methodology for assigning industries to margin loan and commercial credit card exposure.
These exposures were previously assigned to Other.
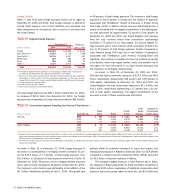
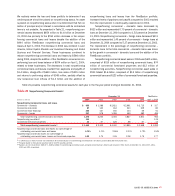
Table 16 presents outstanding commercial real estate loans by
geographic region and by property type. The amounts outstanding
exclude commercial loans and leases secured by owner-occupied real
estate. Therefore, the amounts exclude outstanding loans and leases
that were made on the general creditworthiness of the borrower for
which real estate was obtained as security and for which the ultimate
repayment of the credit is not dependent on the sale, lease, rental or
refinancing of the real estate. As shown in the table, the commercial
real estate loan portfolio is diversified in terms of geographic region
and property type.
Table 16
Outstanding Commercial Real Estate Loans(1)
December 31 FleetBoston
(Dollars in millions) 2004 2003 April 1, 2004
■■■■■
By Geographic Region(2)
Northeast $ 6,700 $ 683 $ 3,732
California 6,293 4,705 567
Florida 3,562 2,663 215
Southeast 3,448 2,642 387
Southwest 3,265 2,725 389
Northwest 2,038 1,976 68
Midwest 1,860 1,431 347
Midsouth 1,379 1,139 152
Other states(3) 1,184 448 3,234
Geographically diversified 2,150 631 769
Non-U.S. 440 324 122
■■■■■
Total $ 32,319 $ 19,367 $ 9,982
■■■■■
By Property Type
Residential $ 5,992 $ 3,631 $ 314
Office buildings 5,434 3,431 2,649
Apartments 4,940 3,411 1,687
Shopping centers/retail 4,490 2,295 1,474
Land and land development 2,388 1,494 155
Industrial/warehouse 2,263 1,790 351
Hotels/motels 909 548 531
Multiple use 744 560 269
Resorts 252 261 –
Other 4,907 1,946 2,552
■■■■■
Total $ 32,319 $ 19,367 $ 9,982
■■■■■
(1) For purposes of this table, commercial real estate product reflects loans dependent on the sale,
lease or refinance of real estate as the final source of repayment.
(2) Distribution is based on geographic location of collateral. Geographic regions are in the U.S.
unless otherwise noted.
(3) The reduction in Other states subsequent to April 1, 2004 is the result of a more granular
distribution of the FleetBoston portfolio to other geographic regions including the Northeast.