Bank of America 2004 Annual Report Download - page 42
Download and view the complete annual report
Please find page 42 of the 2004 Bank of America annual report below. You can navigate through the pages in the report by either clicking on the pages listed below, or by using the keyword search tool below to find specific information within the annual report.-
 1
1 -
2
-
3
-
4
-
5
-
6
-
7
-
8
-
9
-
10
-
11
-
12
-
13
-
14
-
15
-
16
-
17
-
18
-
19
-
20
-
21
-
22
-
23
-
24
-
25
-
26
-
27
-
28
-
29
-
30
-
31
-
 32
32 -
 33
33 -
 34
34 -
 35
35 -
 36
36 -
 37
37 -
 38
38 -
 39
39 -
 40
40 -
 41
41 -
 42
42 -
 43
43 -
 44
44 -
 45
45 -
 46
46 -
 47
47 -
 48
48 -
 49
49 -
 50
50 -
 51
51 -
 52
52 -
53
-
54
-
55
-
56
-
57
-
58
-
59
-
60
-
61
-
62
-
63
-
64
-
65
-
66
-
67
-
68
-
69
-
70
-
71
-
72
-
73
-
74
-
75
-
76
-
77
-
78
-
79
-
80
-
81
-
82
-
83
-
84
-
85
-
86
-
87
-
88
-
89
-
90
-
91
-
92
-
93
-
94
-
95
-
96
-
97
-
98
-
99
-
100
-
101
-
102
-
103
-
104
-
105
-
106
-
107
-
108
-
109
-
110
-
111
-
112
-
113
-
114
-
115
-
116
-
117
-
118
-
119
-
120
-
121
-
122
-
123
-
124
-
125
-
126
-
127
-
128
-
129
-
130
-
131
-
132
-
133
-
134
-
135
-
136
-
137
-
138
-
139
-
140
-
141
-
142
-
143
-
144
-
145
-
146
-
147
-
148
-
149
-
150
-
151
-
152
-
153
-
154
 |
 |

BANK OF AMERICA 2004 41
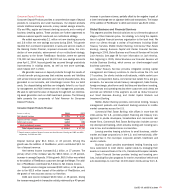
Equity is allocated to business segments using a risk-adjusted
methodology incorporating each unit’s credit, market and operational
risk components. The nature of these risks is discussed further
beginning on page 58. ROE is calculated by dividing Net Income by
allocated equity. SVA is defined as cash basis earnings on an oper-
ating basis less a charge for the use of capital (i.e. equity). Cash
basis earnings on an operating basis are defined as Net Income
adjusted to exclude Merger and Restructuring Charges, and
Amortization of Intangibles. The charge for use of capital is calcu-
lated by multiplying 11 percent (management’s estimate of the share-
holders’ minimum required rate of return on capital invested) by
average total common shareholders’ equity at the corporate level and
by average allocated equity at the business segment level. Average
equity is allocated to the business level using a methodology identi-
cal to that used in the ROE calculation. Management reviews the esti-
mate of the rate used to calculate the capital charge annually. In
2003, management reduced this rate from 12 percent to 11 percent.
We use the Capital Asset Pricing Model to estimate our cost of capital.
The change in the cost of capital rate from 12 percent to 11 percent
was driven by a decline in long-term Treasury rates, which impacted
the risk-free rate component of the calculation.
See Note 19 of the Consolidated Financial Statements for addi-
tional business segment information, selected financial information
for the business segments and reconciliations to consolidated Total
Revenue, Net Income and Total Assets amounts.
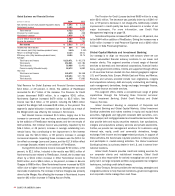
Global Consumer and Small Business Banking
Our strategy is to attract, retain and deepen customer relationships.
A critical component of that strategy includes continuously improving
customer satisfaction. We believe this focus will help us achieve our
goal of being recognized as the best retail bank in North America.
The major businesses within this segment are Consumer
Banking, Consumer Products and Small Business Banking.
Consumer Banking distributes a wide range of services to
33 million consumer households in 29 states and the District of
Columbia through its network of 5,885 banking centers, 16,791
domestic branded ATMs, and telephone and Internet channels.
Consumer Banking distributes a wide range of products, and serv-
ices, including deposit products such as checking accounts, money
market savings accounts, time deposits and IRAs, debit card products,
and credit products such as credit card, home equity products and
residential mortgages. Consumer Banking recorded $16.7 billion of
Total Revenue for 2004. This represented a 35 percent increase. Total
average Deposits within Consumer Banking were $276.7 billion, up 35
percent from 2003.
Consumer Products provides and manages products and services
including the issuance and servicing of credit cards, origination,
fulfillment and servicing of residential mortgage loans, including
home equity loan products, direct banking via the Internet, deposit
services, student lending and certain insurance services. Consumer
Products contributed $8.4 billion of Total Revenue, which represented
a 16 percent improvement. Average Loans and Leases during the
year increased 52 percent to $49.9 billion.
Small Business Banking helps small businesses grow through
the offering of business products and services which include payroll,
merchant services, online banking and bill payment, as well as 401(k)
programs. In addition, we provide specialized products like treasury
management, lockbox, check cards with photo security and succession
planning. Small Business Banking reported $1.7 billion of Total
Revenue, compared to $1.2 billion in 2003. Average Loans and
Leases improved 28 percent to $15.3 billion. Also, Total Deposits
within Small Business Banking grew 37 percent to $31.9 billion due
to the impact of the Merger and account growth.
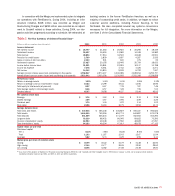
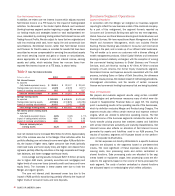
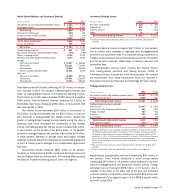
Global Consumer and Small Business Banking
(Dollars in millions) 2004 2003
Net interest income (fully taxable-equivalent basis) $ 17,308 $ 12,114
Noninterest income 9,549 8,816
Total revenue 26,857 20,930
Provision for credit losses 3,341 1,678
Gains on sales of debt securities 117 13
Noninterest expense 13,334 10,333
Income before income taxes 10,299 8,932
Income tax expense 3,751 3,226
Net income $ 6,548 $ 5,706
Shareholder value added $ 3,390 $ 4,367
Net interest yield (fully taxable-equivalent basis) 5.35% 4.98%
Return on average equity 19.89 42.25
Efficiency ratio (fully taxable-equivalent basis) 49.64 49.37
Average:
Total loans and leases $137,357 $ 92,776
Total assets 352,789 258,251
Total deposits 314,652 240,371
Common equity/Allocated equity 32,925 13,505
Year end:
Total loans and leases 156,280 97,341
Total assets 378,359 264,578
Total deposits 333,723 240,428
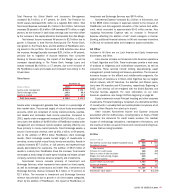
Total Revenue for Global Consumer and Small Business Banking
increased $5.9 billion, or 28 percent, of which FleetBoston con-
tributed $4.3 billion. Provision for Credit Losses increased $1.7 billion
to $3.3 billion. Noninterest Expense grew by $3.0 billion, or 29 percent,
to $13.3 billion. Net Income rose $842 million, or 15 percent, including
the $1.1 billion impact of the addition of FleetBoston. SVA decreased
$977 million, or 22 percent. This decrease was caused by an
increase in the capital allocation as a result of the Merger partially
offset by the increase in cash basis earnings.