Bank of America 2004 Annual Report Download - page 146
Download and view the complete annual report
Please find page 146 of the 2004 Bank of America annual report below. You can navigate through the pages in the report by either clicking on the pages listed below, or by using the keyword search tool below to find specific information within the annual report.-
 1
1 -
2
-
3
-
4
-
5
-
6
-
7
-
8
-
9
-
10
-
11
-
12
-
13
-
14
-
15
-
16
-
17
-
18
-
19
-
20
-
21
-
22
-
23
-
24
-
25
-
26
-
27
-
28
-
29
-
30
-
31
-
32
-
33
-
34
-
35
-
36
-
37
-
38
-
39
-
40
-
41
-
42
-
43
-
44
-
45
-
46
-
47
-
48
-
49
-
50
-
51
-
52
-
53
-
54
-
55
-
56
-
57
-
58
-
59
-
60
-
61
-
62
-
63
-
64
-
65
-
66
-
67
-
68
-
69
-
70
-
71
-
72
-
73
-
74
-
75
-
76
-
77
-
78
-
79
-
80
-
81
-
82
-
83
-
84
-
85
-
86
-
87
-
88
-
89
-
90
-
91
-
92
-
93
-
94
-
95
-
96
-
97
-
98
-
99
-
100
-
101
-
102
-
103
-
104
-
105
-
106
-
107
-
108
-
109
-
110
-
111
-
112
-
113
-
114
-
115
-
116
-
117
-
118
-
119
-
120
-
121
-
122
-
123
-
124
-
125
-
126
-
127
-
128
-
129
-
130
-
131
-
132
-
133
-
134
-
135
-
 136
136 -
 137
137 -
 138
138 -
 139
139 -
 140
140 -
 141
141 -
 142
142 -
 143
143 -
 144
144 -
 145
145 -
 146
146 -
 147
147 -
 148
148 -
 149
149 -
 150
150 -
 151
151 -
 152
152 -
 153
153 -
 154
154
 |
 |

BANK OF AMERICA 2004 145
the same counterparty on a net basis. For exchange-traded contracts,
fair value is based on quoted market prices. For non-exchange traded
contracts, fair value is based on dealer quotes, pricing models or
quoted prices for instruments with similar characteristics. The fair
value of the Corporation’s derivative assets and liabilities is pre-
sented in Note 4 of the Consolidated Financial Statements.
Loans
Fair values were estimated for groups of similar loans based upon
type of loan and maturity. The fair value of loans was determined by
discounting estimated cash flows using interest rates approximating
the Corporation’s current origination rates for similar loans and
adjusted to reflect the inherent credit risk. Where quoted market
prices were available, primarily for certain residential mortgage loans
and commercial loans, such market prices were utilized as estimates
for fair values.
Substantially all of the foreign loans reprice within relatively
short timeframes. Accordingly, for foreign loans, the net carrying val-
ues were assumed to approximate their fair values.
Deposits
The fair value for deposits with stated maturities was calculated by
discounting contractual cash flows using current market rates for
instruments with similar maturities. The carrying value of foreign time
deposits approximates fair value. For deposits with no stated matu-
rities, the carrying amount was considered to approximate fair value
and does not take into account the significant value of the cost
advantage and stability of the Corporation’s long-term relationships
with depositors.
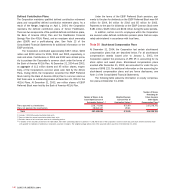
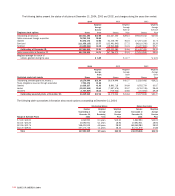
The book and fair values of certain financial instruments at
December 31, 2004 and 2003 were as follows:
December 31
2004 2003
Book Fair Book Fair
(Dollars in millions) Value Value Value Value
Financial assets
Loans $491,615 $496,873 $353,924 $357,770
Financial liabilities
Deposits 618,570 618,409 414,113 414,379
Long-term debt 98,078 102,439 75,343 79,442
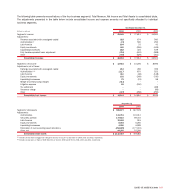
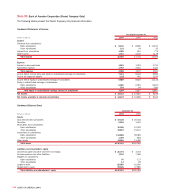
Note 19
Business Segment Information
In connection with the Merger, the Corporation realigned its business
segment reporting to reflect the new business model of the combined
company. The Corporation reports the results of its operations
through four business segments: Global Consumer and Small
Business Banking, Global Business and Financial Services, Global
Capital Markets and Investment Banking, and Global Wealth and
Investment Management. Certain operating segments have been
aggregated into a single business segment. The Corporation may
periodically reclassify business segment results based on modifica-
tions to its management reporting and profitability measurement
methodologies, and changes in organizational alignment.
Global Consumer and Small Business Banking provides a diver-
sified range of products and services to individuals and small busi-
nesses through multiple delivery channels. Global Business and
Financial Services primarily provides commercial lending and treasury
management services to middle-market companies. Global Capital
Markets and Investment Banking provides capital-raising solutions,
advisory services, derivatives capabilities, equity and debt sales and
trading for the Corporation’s clients as well as traditional bank
deposit and loan products, treasury management and payment
services to large corporations and institutional clients. Global Wealth
and Investment Management offers investment, fiduciary and com-
prehensive banking and credit expertise, asset management
services to institutional clients, high-net-worth individuals and retail
customers, investment, securities and financial planning services to
affluent and high-net-worth individuals, and retail clearing services
for broker/dealers.
All Other consists primarily of Latin America, Equity Investments,
Noninterest Income and Expense amounts associated with the ALM
process, including Gains on Sales of Debt Securities, the allowance
for credit losses process, the residual impact of methodology alloca-
tions, intersegment eliminations, and the results of certain consumer
finance and commercial lending businesses that are being liquidated.
Latin America includes the Corporation’s full-service Latin American
operations in Brazil, Argentina and Chile.
Total Revenue includes Net Interest Income on a fully taxable-
equivalent basis and Noninterest Income. The adjustment of Net
Interest Income to a fully taxable-equivalent basis results in a corre-
sponding increase in Income Tax Expense. The Net Interest Income
of the business segments includes the results of a funds transfer
pricing process that matches assets and liabilities with similar inter-
est rate sensitivity and maturity characteristics. Net Interest Income
also reflects an allocation of Net Interest Income generated by
assets and liabilities used in the Corporation’s ALM process.
Certain expenses not directly attributable to a specific business
segment are allocated to the segments based on pre-determined
means. The most significant of these expenses include data pro-
cessing costs, item processing costs and certain centralized or
shared functions. Data processing costs are allocated to the seg-
ments based on equipment usage. Item processing costs are allo-
cated to the segments based on the volume of items processed for
each segment. The costs of certain centralized or shared functions
are allocated based on methodologies which reflect utilization.