Bank of America 2004 Annual Report Download - page 143
Download and view the complete annual report
Please find page 143 of the 2004 Bank of America annual report below. You can navigate through the pages in the report by either clicking on the pages listed below, or by using the keyword search tool below to find specific information within the annual report.-
 1
1 -
2
-
3
-
4
-
5
-
6
-
7
-
8
-
9
-
10
-
11
-
12
-
13
-
14
-
15
-
16
-
17
-
18
-
19
-
20
-
21
-
22
-
23
-
24
-
25
-
26
-
27
-
28
-
29
-
30
-
31
-
32
-
33
-
34
-
35
-
36
-
37
-
38
-
39
-
40
-
41
-
42
-
43
-
44
-
45
-
46
-
47
-
48
-
49
-
50
-
51
-
52
-
53
-
54
-
55
-
56
-
57
-
58
-
59
-
60
-
61
-
62
-
63
-
64
-
65
-
66
-
67
-
68
-
69
-
70
-
71
-
72
-
73
-
74
-
75
-
76
-
77
-
78
-
79
-
80
-
81
-
82
-
83
-
84
-
85
-
86
-
87
-
88
-
89
-
90
-
91
-
92
-
93
-
94
-
95
-
96
-
97
-
98
-
99
-
100
-
101
-
102
-
103
-
104
-
105
-
106
-
107
-
108
-
109
-
110
-
111
-
112
-
113
-
114
-
115
-
116
-
117
-
118
-
119
-
120
-
121
-
122
-
123
-
124
-
125
-
126
-
127
-
128
-
129
-
130
-
131
-
132
-
 133
133 -
 134
134 -
 135
135 -
 136
136 -
 137
137 -
 138
138 -
 139
139 -
 140
140 -
 141
141 -
 142
142 -
 143
143 -
 144
144 -
 145
145 -
 146
146 -
 147
147 -
 148
148 -
 149
149 -
 150
150 -
 151
151 -
 152
152 -
 153
153 -
154
 |
 |

142 BANK OF AMERICA 2004
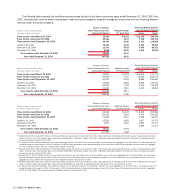
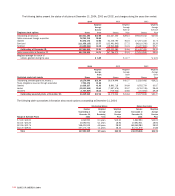
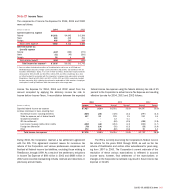
The following tables present the status of all plans at December 31, 2004, 2003 and 2002, and changes during the years then ended:
2004 2003 2002
Weighted Weighted Weighted
Average Average Average
Exercise Exercise Exercise
Employee stock options Shares Price Shares Price Shares Price
Outstanding at January 1 320,331,380 $30.66 411,447,300 $29.10 369,100,032 $27.60
Options assumed through acquisition 78,761,708 28.68 –– ––
Granted 63,472,170 40.80 61,336,790 35.03 171,671,430 30.73
Exercised (111,958,135) 27.77 (132,491,842) 27.72 (98,116,356) 26.20
Forfeited (13,055,564) 34.15 (19,960,868) 31.41 (31,207,806) 29.37
Outstanding at December 31 337,551,559 32.93 320,331,380 30.66 411,447,300 29.10
Options exercisable at December 31 243,735,846 30.73 167,786,372 30.02 179,151,940 29.51
Weighted average fair value of
options granted during the year $ 5.59 $ 6.77 $ 6.21
2004 2003 2002
Weighted Weighted Weighted
Average Average Average
Grant Grant Grant
Restricted stock/unit awards Shares Price Shares Price Shares Price
Outstanding unvested grants at January 1 16,170,546 $31.64 15,679,946 $30.37 13,183,492 $29.21
Share obligations assumed through acquisition 7,720,476 31.62 –– ––
Granted 10,338,327 41.03 8,893,718 34.69 9,532,754 30.57
Vested (12,031,945) 29.43 (7,697,576) 32.47 (6,763,746) 28.44
Canceled (1,747,839) 38.10 (705,542) 32.85 (272,554) 29.48
Outstanding unvested grants at December 31 20,449,565 $37.12 16,170,546 $31.64 15,679,946 $30.37
The following table summarizes information about stock options outstanding at December 31, 2004:
Outstanding Options Options Exercisable
Number Weighted Weighted Number Weighted
Outstanding at Average Average Exercisable at Average
December 31, Remaining Exercise December 31, Exercise
Range of Exercise Prices 2004 Term Price 2004 Price
$05.00-$15.00 1,262,953 0.4 years $12.23 1,262,953 $12.23
$15.01-$23.25 10,692,931 5.1 years 18.94 10,692,931 18.94
$23.26-$32.75 168,421,939 4.8 years 28.93 168,068,284 28.92
$32.76-$49.50 157,173,736 7.1 years 38.34 63,711,678 37.86
Total 337,551,559 5.9 years $32.93 243,735,846 $30.73