Bank of America 2004 Annual Report Download - page 73
Download and view the complete annual report
Please find page 73 of the 2004 Bank of America annual report below. You can navigate through the pages in the report by either clicking on the pages listed below, or by using the keyword search tool below to find specific information within the annual report.-
 1
1 -
2
-
3
-
4
-
5
-
6
-
7
-
8
-
9
-
10
-
11
-
12
-
13
-
14
-
15
-
16
-
17
-
18
-
19
-
20
-
21
-
22
-
23
-
24
-
25
-
26
-
27
-
28
-
29
-
30
-
31
-
32
-
33
-
34
-
35
-
36
-
37
-
38
-
39
-
40
-
41
-
42
-
43
-
44
-
45
-
46
-
47
-
48
-
49
-
50
-
51
-
52
-
53
-
54
-
55
-
56
-
57
-
58
-
59
-
60
-
61
-
62
-
 63
63 -
 64
64 -
 65
65 -
 66
66 -
 67
67 -
 68
68 -
 69
69 -
 70
70 -
 71
71 -
 72
72 -
 73
73 -
 74
74 -
 75
75 -
 76
76 -
 77
77 -
 78
78 -
 79
79 -
 80
80 -
 81
81 -
 82
82 -
 83
83 -
84
-
85
-
86
-
87
-
88
-
89
-
90
-
91
-
92
-
93
-
94
-
95
-
96
-
97
-
98
-
99
-
100
-
101
-
102
-
103
-
104
-
105
-
106
-
107
-
108
-
109
-
110
-
111
-
112
-
113
-
114
-
115
-
116
-
117
-
118
-
119
-
120
-
121
-
122
-
123
-
124
-
125
-
126
-
127
-
128
-
129
-
130
-
131
-
132
-
133
-
134
-
135
-
136
-
137
-
138
-
139
-
140
-
141
-
142
-
143
-
144
-
145
-
146
-
147
-
148
-
149
-
150
-
151
-
152
-
153
-
154
 |
 |

72 BANK OF AMERICA 2004
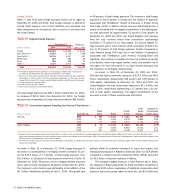
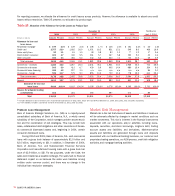
Problem Loan Management
Banc of America Strategic Solutions, Inc. (SSI) is a majority-owned
consolidated subsidiary of Bank of America, N.A., a wholly owned
subsidiary of the Corporation, which manages problem asset resolu-
tion and the coordination of exit strategies. This may include bulk
sales, collateralized debt obligations and other resolutions of domes-
tic commercial distressed assets and, beginning in 2004, certain
consumer distressed loans.
During 2004 and 2003, Bank of America, N.A. sold commercial
loans with a gross book balance of approximately $1.0 billion and
$3.0 billion, respectively, to SSI. In addition, in December of 2004,
Bank of America, N.A. and NationsCredit Financial Services
Corporation sold manufactured housing loans with a gross book bal-
ance of $2.9 billion, to SSI. For tax purposes, under the Code, the
sales were treated as a taxable exchange. The sales had no financial
statement impact on us because the sales were transfers among
entities under common control, and there was no change in the
individual loan resolution strategies.
Market Risk Management
Market risk is the risk that values of assets and liabilities or revenues
will be adversely affected by changes in market conditions such as
market movements. This risk is inherent in the financial instruments
associated with our operations and/or activities including loans,
deposits, securities, short-term borrowings, long-term debt, trading
account assets and liabilities, and derivatives. Market-sensitive
assets and liabilities are generated through loans and deposits
associated with our traditional banking business, our customer and
proprietary trading operations, our ALM process, credit risk mitigation
activities, and mortgage banking activities.
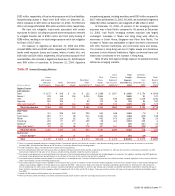
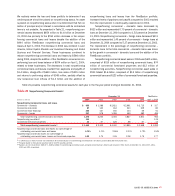
For reporting purposes, we allocate the allowance for credit losses across products. However, the allowance is available to absorb any credit
losses without restriction. Table 25 presents our allocation by product type.
Table 25
Allocation of the Allowance for Credit Losses by Product Type
December 31 FleetBoston
2004 2003 2002 2001 2000 April 1, 2004
■■■■■■■■
(Dollars in millions) Amount Percent Amount Percent Amount Percent Amount Percent Amount Percent Amount Percent
■■■■■■■■
Allowance for loan and
lease losses
Residential mortgage $ 199 2.3% $ 149 2.4% $ 108 1.7% $ 145 2.3% $ 151 2.4% $ 40 1.4%
Credit card 2,757 32.0 1,602 26.0 1,031 16.2 821 13.1 549 8.6 466 16.9
Home equity lines 92 1.1 61 1.0 49 0.8 83 1.3 77 1.2 17 0.6
Direct/Indirect consumer 405 4.7 340 5.5 361 5.7 367 5.8 320 5.0 43 1.6
Other consumer 382 4.4 384 6.2 332 5.2 443 7.1 733 11.5 26 0.9
■■■■■■■■
Total consumer 3,835 44.5 2,536 41.1 1,881 29.6 1,859 29.6 1,830 28.7 592 21.4
■■■■■■■■
Commercial – domestic 1,382 16.0 1,257 20.4 2,231 35.1 1,901 30.3 1,926 30.3 704 25.5
Commercial real estate 505 5.9 413 6.7 439 6.9 905 14.4 980 15.4 264 9.6
Commercial lease financing 365 4.2 207 3.4 n/a n/a n/a n/a n/a n/a 84 3.0
Commercial – foreign 926 10.7 575 9.3 855 13.4 730 11.6 778 12.2 611 22.1
■■■■■■■■
Total commercial(1) 3,178 36.8 2,452 39.8 3,525 55.4 3,536 56.3 3,684 57.9 1,663 60.2
■■■■■■■■
General 1,613 18.7 1,175 19.1 952 15.0 883 14.1 851 13.4 508 18.4
■■■■■■■■
Allowance for loan and
lease losses 8,626 100.0% 6,163 100.0% 6,358 100.0% 6,278 100.0% 6,365 100.0% 2,763 100.0%
■■■■■■■■
Reserve for unfunded lending
commitments 402 416 493 597 473 85
■■■■■■■■
Total $ 9,028 $ 6,579 $6,851 $6,875 $6,838 $2,848
■■■■■■■■
(1) Includes allowance for loan and lease losses of commercial impaired loans of $202, $391, $919, $763 and $640 at December 31, 2004, 2003, 2002, 2001 and 2000, respectively.
n/a = Not available; included in commercial - domestic at December 31, 2002, 2001 and 2000.