Bank of America 2004 Annual Report Download - page 119
Download and view the complete annual report
Please find page 119 of the 2004 Bank of America annual report below. You can navigate through the pages in the report by either clicking on the pages listed below, or by using the keyword search tool below to find specific information within the annual report.-
 1
1 -
2
-
3
-
4
-
5
-
6
-
7
-
8
-
9
-
10
-
11
-
12
-
13
-
14
-
15
-
16
-
17
-
18
-
19
-
20
-
21
-
22
-
23
-
24
-
25
-
26
-
27
-
28
-
29
-
30
-
31
-
32
-
33
-
34
-
35
-
36
-
37
-
38
-
39
-
40
-
41
-
42
-
43
-
44
-
45
-
46
-
47
-
48
-
49
-
50
-
51
-
52
-
53
-
54
-
55
-
56
-
57
-
58
-
59
-
60
-
61
-
62
-
63
-
64
-
65
-
66
-
67
-
68
-
69
-
70
-
71
-
72
-
73
-
74
-
75
-
76
-
77
-
78
-
79
-
80
-
81
-
82
-
83
-
84
-
85
-
86
-
87
-
88
-
89
-
90
-
91
-
92
-
93
-
94
-
95
-
96
-
97
-
98
-
99
-
100
-
101
-
102
-
103
-
104
-
105
-
106
-
107
-
108
-
 109
109 -
 110
110 -
 111
111 -
 112
112 -
 113
113 -
 114
114 -
 115
115 -
 116
116 -
 117
117 -
 118
118 -
 119
119 -
 120
120 -
 121
121 -
 122
122 -
 123
123 -
 124
124 -
 125
125 -
 126
126 -
 127
127 -
 128
128 -
 129
129 -
130
-
131
-
132
-
133
-
134
-
135
-
136
-
137
-
138
-
139
-
140
-
141
-
142
-
143
-
144
-
145
-
146
-
147
-
148
-
149
-
150
-
151
-
152
-
153
-
154
 |
 |

118 BANK OF AMERICA 2004
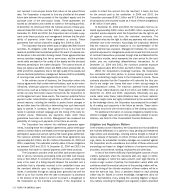
The sensitivities in the preceding table are hypothetical and should
be used with caution. As the amounts indicate, changes in fair value
based on variations in assumptions generally cannot be extrapolated
because the relationship of the change in assumption to the change
in fair value may not be linear. Also, the effect of a variation in a par-
ticular assumption on the fair value of the retained interest is cal-
culated without changing any other assumption. In reality, changes in
one factor may result in changes in another, which might magnify or
counteract the sensitivities. Additionally, the Corporation has the
ability to hedge interest rate risk associated with retained residual
positions. The above sensitivities do not reflect any hedge strategies
that may be undertaken to mitigate such risk.
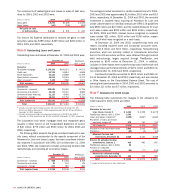
Static pool net credit losses are considered in determining the
value of retained interests. Static pool net credit losses include
actual losses incurred plus projected credit losses divided by the orig-
inal balance of each securitization pool. Expected static pool net
credit losses at December 31, 2004 for the 2004 auto loan securiti-
zation were 1.63 percent. For the subprime consumer finance secu-
ritizations, weighted average static pool net credit losses for 2001,
1999, 1998, 1997 and 1995 were 5.93 percent, 11.67 percent,
9.20 percent, 4.92 percent and 12.25 percent, respectively at
December 31, 2004, and 5.83 percent, 9.91 percent, 8.22 percent,
4.92 percent and 10.83 percent, respectively, at December 31, 2003.
Proceeds from collections reinvested in revolving credit card
securitizations were $6.8 billion and $3.8 billion in 2004 and 2003,
respectively. Credit card servicing fee income totaled $134 million
and $51 million in 2004 and 2003, respectively. Other cash flows
received on retained interests, such as cash flows from interest-only
strips, were $345 million and $279 million in 2004 and 2003,
respectively, for credit card securitizations. Proceeds from
collections reinvested in revolving commercial loan securitizations
were $1.1 billion in 2004. Servicing fees and other cash flows
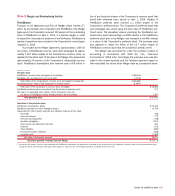
Home
Subprime Consumer Automobile Equity Commercial
Credit Card Finance(1) Loans(2) Lines Loans
(Dollars in millions) 2004 2003 2004 2003 2004 2004 2004
Carrying amount of residual interests (at fair value)(2) $ 349 $76 $ 313 $ 328 $ 34 $ 17 $ 130
Balance of unamortized securitized loans 6,903 1,782 5,886 9,409 1,644 630 3,337
Weighted average life to call (in years)(3) 1.2 1.4 1.3 1.6 1.4 1.3 n/a
Revolving structures – annual payment rate 13.7% 14.9% 45.0% 4.5%(4)
Amortizing structures – annual constant prepayment rate:
Fixed rate loans 7.5 -32.7% 7.8-32.6% 24.9%
Adjustable rate loans 27.0-40.8 27.0- 42.4 –
Impact on fair value of 100 bps favorable change $1 $– $1 $4 $– $– $2
Impact on fair value of 200 bps favorable change 2–11 11 –12
Impact on fair value of 100 bps adverse change (1) –(9) (11) – – (1)
Impact on fair value of 200 bps adverse change (2) –(17) (15) (1) (1) (1)
Expected credit losses(5) 5.3-9.7% 5.3% 5.1- 12.3% 4.6-11.0% 1.6% 0.2% 0.4%
Impact on fair value of 10% favorable change $18 $ 2$27 $37 $3 $– $1
Impact on fair value of 25% favorable change 47 571 100 6–2
Impact on fair value of 10% adverse change (15) (2) (27) (37) (2) – (1)
Impact on fair value of 25% adverse change (27) (5) (68) (82) (6) – (2)
Residual cash flows discount rate (annual rate) 6.0-12.0% 6.0% 15.0-30.0% 15.0-30.0% 20.0% 12.0% 12.3%
Impact on fair value of 100 bps favorable change $– $– $6 $8 $1 $– $1
Impact on fair value of 200 bps favorable change ––12 16 1–2
Impact on fair value of 100 bps adverse change ––(6) (8) (1) – (1)
Impact on fair value of 200 bps adverse change ––(12) (15) (1) – (2)
(1) Subprime consumer finance includes subprime real estate loan and manufactured housing loan securitizations, which are all serviced by third parties.
(2) Residual interests include interest-only strips, one or more subordinated tranches, accrued interest receivable, and in some cases, a cash reserve account.
(3) Before any optional clean-up calls are executed, economic analyses will be performed.
(4) Monthly average net pay rate (pay rate less draw rate).
(5) Annual rates of expected credit losses are presented for credit card, home equity lines and commercial securitizations. Cumulative lifetime rates of expected credit losses (incurred plus projected) are
presented for subprime consumer finance securitizations and the auto loan securitizations.
n/a = not applicable
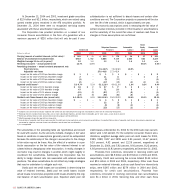
At December 31, 2004 and 2003, investment grade securities
of $2.9 billion and $2.1 billion, respectively, which are valued using
quoted market prices remained in the AFS securities portfolio. At
December 31, 2004 there were no recognized servicing assets
associated with these securitization transactions.
The Corporation has provided protection on a subset of one
consumer finance securitization in the form of a guarantee with a
maximum payment of $220 million that will only be paid if over-
collateralization is not sufficient to absorb losses and certain other
conditions are met. The Corporation projects no payments will be due
over the life of the contract, which is approximately one year.
Key economic assumptions used in measuring the fair value of
certain residual interests (included in Other Assets) in securitizations
and the sensitivity of the current fair value of residual cash flows to
changes in those assumptions are as follows: