Bank of America 2004 Annual Report Download - page 60
Download and view the complete annual report
Please find page 60 of the 2004 Bank of America annual report below. You can navigate through the pages in the report by either clicking on the pages listed below, or by using the keyword search tool below to find specific information within the annual report.-
 1
1 -
2
-
3
-
4
-
5
-
6
-
7
-
8
-
9
-
10
-
11
-
12
-
13
-
14
-
15
-
16
-
17
-
18
-
19
-
20
-
21
-
22
-
23
-
24
-
25
-
26
-
27
-
28
-
29
-
30
-
31
-
32
-
33
-
34
-
35
-
36
-
37
-
38
-
39
-
40
-
41
-
42
-
43
-
44
-
45
-
46
-
47
-
48
-
49
-
 50
50 -
 51
51 -
 52
52 -
 53
53 -
 54
54 -
 55
55 -
 56
56 -
 57
57 -
 58
58 -
 59
59 -
 60
60 -
 61
61 -
 62
62 -
 63
63 -
 64
64 -
 65
65 -
 66
66 -
 67
67 -
 68
68 -
 69
69 -
 70
70 -
71
-
72
-
73
-
74
-
75
-
76
-
77
-
78
-
79
-
80
-
81
-
82
-
83
-
84
-
85
-
86
-
87
-
88
-
89
-
90
-
91
-
92
-
93
-
94
-
95
-
96
-
97
-
98
-
99
-
100
-
101
-
102
-
103
-
104
-
105
-
106
-
107
-
108
-
109
-
110
-
111
-
112
-
113
-
114
-
115
-
116
-
117
-
118
-
119
-
120
-
121
-
122
-
123
-
124
-
125
-
126
-
127
-
128
-
129
-
130
-
131
-
132
-
133
-
134
-
135
-
136
-
137
-
138
-
139
-
140
-
141
-
142
-
143
-
144
-
145
-
146
-
147
-
148
-
149
-
150
-
151
-
152
-
153
-
154
 |
 |

BANK OF AMERICA 2004 59
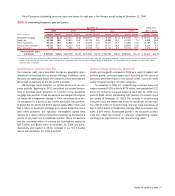
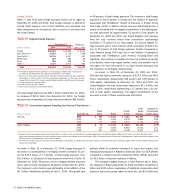
Concentrations of Consumer Credit Risk
Our consumer credit risk is diversified through our geographic span,
diversity of our franchise and our product offerings. In addition, credit
decisions are statistically based with tolerances set to decrease the
percentage of approvals as the risk profile increases.
We purchase credit protection on certain portions of our con-
sumer portfolio. Beginning in 2003, we entered into several transac-
tions to purchase credit protection on a portion of our residential
mortgage loan portfolio. These transactions are designed to enhance
our overall risk management strategy. In 2004, we entered into a sim-
ilar transaction for a portion of our indirect automobile loan portfolio.
At December 31, 2004 and 2003, approximately $88.7 billion and
$63.4 billion of residential mortgage and indirect automobile loans
were credit protected. Our regulatory risk-weighted assets were
reduced as a result of these transactions because we transferred a
portion of our credit risk to unaffiliated parties. These transactions
had the cumulative effect of reducing our risk-weighted assets by
$25.5 billion and $18.6 billion at December 31, 2004 and 2003,
respectively, and resulted in 26 bp increases in our Tier 1 Capital
ratio at both December 31, 2004 and 2003.
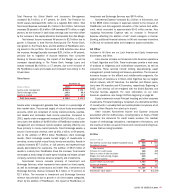
Consumer Portfolio Credit Quality Performance
Credit card charge-offs increased in 2004 as a result of organic card
portfolio growth, continued seasoning of accounts and the return of
previously securitized loans to the balance sheet. Consumer credit
quality remained strong in all other categories.
As presented in Table 10, nonperforming consumer loans and
leases increased $100 million to $738 million, and represented 0.23
percent of consumer loans and leases at December 31, 2004 com-
pared to $638 million, representing 0.27 percent of consumer loans
and leases at December 31, 2003. The increase in nonperforming
consumer loans and leases was driven by loan growth and the addi-
tion of $127 million of nonperforming consumer loans and leases on
April 1, 2004 related to FleetBoston, partially offset by consumer loan
sales of $95 million. Broad-based growth in the consumer portfolio
more than offset the increase in consumer nonperforming assets,
resulting in an improvement in the nonperforming ratios.
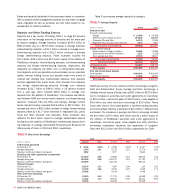
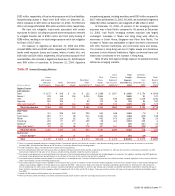
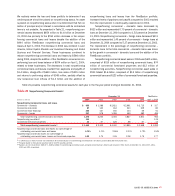
Table 9 presents outstanding consumer loans and leases for each year in the five-year period ending at December 31, 2004.
Table 9
Outstanding Consumer Loans and Leases
December 31 FleetBoston
2004 2003 2002 2001 2000 April 1, 2004
■■■■■
(Dollars in millions) Amount Percent Amount Percent Amount Percent Amount Percent Amount Percent Amount Percent
■■■■■
Residential mortgage $178,103 54.3% $140,513 58.5% $108,197 54.8% $ 78,203 47.3% $ 84,394 44.7% $ 34,571 55.2%
Credit card 51,726 15.8 34,814 14.5 24,729 12.5 19,884 12.0 14,094 7.5 6,848 10.9
Home equity lines 50,126 15.3 23,859 9.9 23,236 11.8 22,107 13.4 21,598 11.5 13,799 22.1
Direct/Indirect consumer 40,513 12.3 33,415 13.9 31,068 15.7 30,317 18.4 29,859 15.8 6,113 9.8
Other consumer(1) 7,439 2.3 7,558 3.2 10,355 5.2 14,744 8.9 38,706 20.5 1,272 2.0
■■■■■
Total consumer loans
and leases $327,907 100.0% $240,159 100.0% $197,585 100.0% $165,255 100.0% $188,651 100.0% $ 62,603 100.0%
■■■■■
(1) Includes consumer finance of $3,395, $3,905, $4,438, $5,331 and $25,799 at December 31, 2004, 2003, 2002, 2001 and 2000, respectively; foreign consumer of $3,563, $1,969, $1,970, $2,092
and $2,308 at December 31, 2004, 2003, 2002, 2001 and 2000, respectively; and consumer lease financing of $481, $1,684, $3,947, $7,321 and $10,599 at December 31, 2004, 2003, 2002,
2001 and 2000, respectively.