Bank of America 2004 Annual Report Download - page 85
Download and view the complete annual report
Please find page 85 of the 2004 Bank of America annual report below. You can navigate through the pages in the report by either clicking on the pages listed below, or by using the keyword search tool below to find specific information within the annual report.-
 1
1 -
2
-
3
-
4
-
5
-
6
-
7
-
8
-
9
-
10
-
11
-
12
-
13
-
14
-
15
-
16
-
17
-
18
-
19
-
20
-
21
-
22
-
23
-
24
-
25
-
26
-
27
-
28
-
29
-
30
-
31
-
32
-
33
-
34
-
35
-
36
-
37
-
38
-
39
-
40
-
41
-
42
-
43
-
44
-
45
-
46
-
47
-
48
-
49
-
50
-
51
-
52
-
53
-
54
-
55
-
56
-
57
-
58
-
59
-
60
-
61
-
62
-
63
-
64
-
65
-
66
-
67
-
68
-
69
-
70
-
71
-
72
-
73
-
74
-
 75
75 -
 76
76 -
 77
77 -
 78
78 -
 79
79 -
 80
80 -
 81
81 -
 82
82 -
 83
83 -
 84
84 -
 85
85 -
 86
86 -
 87
87 -
 88
88 -
 89
89 -
 90
90 -
 91
91 -
 92
92 -
 93
93 -
 94
94 -
 95
95 -
96
-
97
-
98
-
99
-
100
-
101
-
102
-
103
-
104
-
105
-
106
-
107
-
108
-
109
-
110
-
111
-
112
-
113
-
114
-
115
-
116
-
117
-
118
-
119
-
120
-
121
-
122
-
123
-
124
-
125
-
126
-
127
-
128
-
129
-
130
-
131
-
132
-
133
-
134
-
135
-
136
-
137
-
138
-
139
-
140
-
141
-
142
-
143
-
144
-
145
-
146
-
147
-
148
-
149
-
150
-
151
-
152
-
153
-
154
 |
 |

84 BANK OF AMERICA 2004
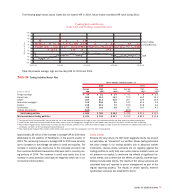
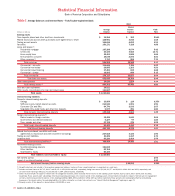
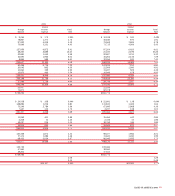
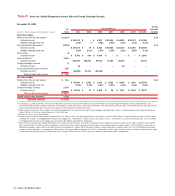
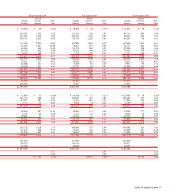
Table I
Average Balances and Interest Rates – Fully Taxable-equivalent Basis
2004
Interest
Average Income/ Yield/
(Dollars in millions) Balance Expense Rate
Earning assets
Time deposits placed and other short-term investments $ 14,254 $ 362 2.54%
Federal funds sold and securities purchased under agreements to resell 128,981 2,043 1.58
Trading account assets 104,616 4,092 3.91
Securities 150,171 7,326 4.88
Loans and leases(1):
Residential mortgage 167,298 9,074 5.42
Credit card 43,435 4,653 10.71
Home equity lines 39,400 1,835 4.66
Direct/Indirect consumer 38,078 2,093 5.50
Other consumer(2) 7,717 594 7.70
Total consumer 295,928 18,249 6.17
Commercial – domestic 114,644 7,126 6.22
Commercial real estate 28,085 1,263 4.50
Commercial lease financing 17,483 819 4.68
Commercial – foreign 16,505 849 5.15
Total commercial 176,717 10,057 5.69
Total loans and leases 472,645 28,306 5.99
Other earning assets 34,635 1,814 5.24
Total earning assets(3) 905,302 43,943 4.85
Cash and cash equivalents 28,511
Other assets, less allowance for loan and lease losses 110,847
Total assets $ 1,044,660
Interest-bearing liabilities
Domestic interest-bearing deposits:
Savings $ 33,959 $ 119 0.35%
NOW and money market deposit accounts 214,542 1,921 0.90
Consumer CDs and IRAs 94,770 2,533 2.67
Negotiable CDs, public funds and other time deposits 5,977 290 4.85
Total domestic interest-bearing deposits 349,248 4,863 1.39
Foreign interest-bearing deposits(4):
Banks located in foreign countries 18,426 1,040 5.64
Governments and official institutions 5,327 97 1.82
Time, savings and other 27,739 275 0.99
Total foreign interest-bearing deposits 51,492 1,412 2.74
Total interest-bearing deposits 400,740 6,275 1.57
Federal funds purchased, securities sold under
agreements to repurchase and other short-term borrowings 227,558 4,434 1.95
Trading account liabilities 35,326 1,317 3.73
Long-term debt 93,330 2,404 2.58
Total interest-bearing liabilities(3) 756,954 14,430 1.91
Noninterest-bearing sources:
Noninterest-bearing deposits 150,819
Other liabilities 52,704
Shareholders’ equity 84,183
Total liabilities and shareholders’ equity $ 1,044,660
Net interest spread 2.94
Impact of noninterest-bearing sources 0.32
Net interest income/yield on earning assets $ 29,513 3.26%
(1) Nonperforming loans are included in the respective average loan balances. Income on these nonperforming loans is recognized on a cash basis.
(2) Includes consumer finance of $3,735, $4,137 and $5,031 in 2004, 2003 and 2002, respectively; foreign consumer of $3,020, $1,977 and $2,021 in 2004, 2003 and 2002, respectively; and
consumer lease financing of $962, $2,751 and $5,502 in 2004, 2003 and 2002, respectively.
(3) Interest income includes the impact of interest rate risk management contracts, which increased interest income on the underlying assets $2,400, $2,972 and $1,983 in 2004, 2003 and 2002,
respectively. These amounts were substantially offset by corresponding decreases in the income earned on the underlying assets. Interest expense includes the impact of interest rate risk management
contracts, which increased interest expense on the underlying liabilities $888, $305 and $141 in 2004, 2003 and 2002, respectively. These amounts were substantially offset by corresponding
decreases in the interest paid on the underlying liabilities. For further information on interest rate contracts, see “Interest Rate Risk Management” beginning on page 76.
(4) Primarily consists of time deposits in denominations of $100,000 or more.
Statistical Financial Information
Bank of America Corporation and Subsidiaries