Bank of America 2004 Annual Report Download - page 72
Download and view the complete annual report
Please find page 72 of the 2004 Bank of America annual report below. You can navigate through the pages in the report by either clicking on the pages listed below, or by using the keyword search tool below to find specific information within the annual report.-
 1
1 -
2
-
3
-
4
-
5
-
6
-
7
-
8
-
9
-
10
-
11
-
12
-
13
-
14
-
15
-
16
-
17
-
18
-
19
-
20
-
21
-
22
-
23
-
24
-
25
-
26
-
27
-
28
-
29
-
30
-
31
-
32
-
33
-
34
-
35
-
36
-
37
-
38
-
39
-
40
-
41
-
42
-
43
-
44
-
45
-
46
-
47
-
48
-
49
-
50
-
51
-
52
-
53
-
54
-
55
-
56
-
57
-
58
-
59
-
60
-
61
-
 62
62 -
 63
63 -
 64
64 -
 65
65 -
 66
66 -
 67
67 -
 68
68 -
 69
69 -
 70
70 -
 71
71 -
 72
72 -
 73
73 -
 74
74 -
 75
75 -
 76
76 -
 77
77 -
 78
78 -
 79
79 -
 80
80 -
 81
81 -
 82
82 -
83
-
84
-
85
-
86
-
87
-
88
-
89
-
90
-
91
-
92
-
93
-
94
-
95
-
96
-
97
-
98
-
99
-
100
-
101
-
102
-
103
-
104
-
105
-
106
-
107
-
108
-
109
-
110
-
111
-
112
-
113
-
114
-
115
-
116
-
117
-
118
-
119
-
120
-
121
-
122
-
123
-
124
-
125
-
126
-
127
-
128
-
129
-
130
-
131
-
132
-
133
-
134
-
135
-
136
-
137
-
138
-
139
-
140
-
141
-
142
-
143
-
144
-
145
-
146
-
147
-
148
-
149
-
150
-
151
-
152
-
153
-
154
 |
 |

BANK OF AMERICA 2004 71
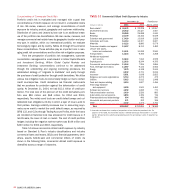
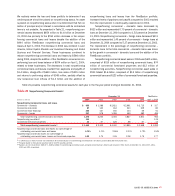
Table 24 presents a rollforward of the allowance for credit losses for five years ending December 31, 2004.
Table 24
Allowance for Credit Losses
(Dollars in millions) 2004 2003 2002 2001 2000
Allowance for loan and lease losses, January 1 $ 6,163 $ 6,358 $ 6,278 $ 6,365 $ 6,314
FleetBoston balance, April 1, 2004 2,763 ––––
Loans and leases charged off
Residential mortgage (62) (64) (56) (39) (36)
Credit card (2,536) (1,657) (1,210) (753) (392)
Home equity lines (38) (38) (40) (32) (29)
Direct/Indirect consumer (344) (322) (355) (389) (395)
Other consumer(1) (295) (343) (395) (1,216) (582)
Total consumer (3,275) (2,424) (2,056) (2,429) (1,434)
Commercial – domestic (504) (857) (1,625) (2,021) (1,396)
Commercial real estate (12) (46) (45) (46) (31)
Commercial lease financing (39) (132) (168) (99) (17)
Commercial – foreign (262) (408) (566) (249) (117)
Total commercial (817) (1,443) (2,404) (2,415) (1,561)
Total loans and leases charged off (4,092) (3,867) (4,460) (4,844) (2,995)
Recoveries of loans and leases previously charged off
Residential mortgage 26 24 14 13 9
Credit card 231 143 116 81 54
Home equity lines 23 26 14 13 9
Direct/Indirect consumer 136 141 145 139 149
Other consumer 102 88 99 135 197
Total consumer 518 422 388 381 418
Commercial – domestic 327 224 314 167 122
Commercial real estate 15 57720
Commercial lease financing 30 8944
Commercial – foreign 89 102 45 41 31
Total commercial 461 339 375 219 177
Total recoveries of loans and leases previously charged off 979 761 763 600 595
Net charge-offs (3,113) (3,106) (3,697) (4,244) (2,400)
Provision for loan and lease losses(2) 2,868 2,916 3,801 4,163 2,576
Transfers(3) (55) (5) (24) (6) (125)
Allowance for loan and lease losses, December 31 8,626 6,163 6,358 6,278 6,365
Reserve for unfunded lending commitments, January 1 416 493 597 473 514
FleetBoston balance, April 1, 2004 85 ––––
Provision for unfunded lending commitments (99) (77) (104) 124 (41)
Reserve for unfunded lending commitments, December 31 402 416 493 597 473
Total $ 9,028 $ 6,579 $ 6,851 $ 6,875 $ 6,838
Loans and leases outstanding at December 31 $521,837 $371,463 $342,755 $329,153 $392,193
Allowance for loan and lease losses as a percentage of loans
and leases outstanding at December 31 1.65% 1.66% 1.85% 1.91% 1.62%
Consumer allowance for loan and lease losses as a percentage
of consumer loans and leases outstanding at December 31 1.17 1.06 0.95 1.12 0.97
Commercial allowance for loan and lease losses as a percentage
of commercial loans and leases outstanding at December 31 1.64 1.87 2.43 2.16 1.81
Average loans and leases outstanding during the year $472,645 $356,148 $336,819 $365,447 $392,622
Net charge-offs as a percentage of average loans and leases
outstanding during the year 0.66% 0.87% 1.10% 1.16% 0.61%
Allowance for loan and lease losses as a percentage of nonperforming
loans and leases at December 31 390 215 126 139 122
Ratio of the allowance for loan and lease losses at December 31
to net charge-offs 2.77 1.98 1.72 1.48 2.65
(1) Includes $635 related to the exit of the subprime real estate lending business in 2001.
(2) Includes $395 related to the exit of the subprime real estate lending business in 2001.
(3) Includes primarily transfers to loans held-for-sale.