Bank of America 2004 Annual Report Download - page 116
Download and view the complete annual report
Please find page 116 of the 2004 Bank of America annual report below. You can navigate through the pages in the report by either clicking on the pages listed below, or by using the keyword search tool below to find specific information within the annual report.-
 1
1 -
2
-
3
-
4
-
5
-
6
-
7
-
8
-
9
-
10
-
11
-
12
-
13
-
14
-
15
-
16
-
17
-
18
-
19
-
20
-
21
-
22
-
23
-
24
-
25
-
26
-
27
-
28
-
29
-
30
-
31
-
32
-
33
-
34
-
35
-
36
-
37
-
38
-
39
-
40
-
41
-
42
-
43
-
44
-
45
-
46
-
47
-
48
-
49
-
50
-
51
-
52
-
53
-
54
-
55
-
56
-
57
-
58
-
59
-
60
-
61
-
62
-
63
-
64
-
65
-
66
-
67
-
68
-
69
-
70
-
71
-
72
-
73
-
74
-
75
-
76
-
77
-
78
-
79
-
80
-
81
-
82
-
83
-
84
-
85
-
86
-
87
-
88
-
89
-
90
-
91
-
92
-
93
-
94
-
95
-
96
-
97
-
98
-
99
-
100
-
101
-
102
-
103
-
104
-
105
-
 106
106 -
 107
107 -
 108
108 -
 109
109 -
 110
110 -
 111
111 -
 112
112 -
 113
113 -
 114
114 -
 115
115 -
 116
116 -
 117
117 -
 118
118 -
 119
119 -
 120
120 -
 121
121 -
 122
122 -
 123
123 -
 124
124 -
 125
125 -
 126
126 -
127
-
128
-
129
-
130
-
131
-
132
-
133
-
134
-
135
-
136
-
137
-
138
-
139
-
140
-
141
-
142
-
143
-
144
-
145
-
146
-
147
-
148
-
149
-
150
-
151
-
152
-
153
-
154
 |
 |

BANK OF AMERICA 2004 115
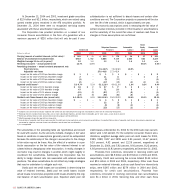
Less than 12 months 12 months or longer Total
(Dollars in millions) Fair Value Unrealized Losses Fair Value Unrealized Losses Fair Value Unrealized Losses
Available-for-sale securities
U.S. Treasury securities and agency debentures(1) $ 381 $ (1) $ 22 $ – $ 403 $ (1)
Mortgage-backed securities 52,687 (297) 17,426 (327) 70,113 (624)
Foreign sovereign securities 4,964 (11) 99 (15) 5,063 (26)
Other taxable securities 1,130 (9) 37 (4) 1,167 (13)
Total taxable 59,162 (318) 17,584 (346) 76,746 (664)
Tax-exempt securities(1) 1,088 (5) 21 – 1,109 (5)
Total temporarily-impaired available-for-sale securities 60,250 (323) 17,605 (346) 77,855 (669)
Temporarily-impaired marketable equity securities 83 (2) – – 83 (2)
Held-to-maturity securities
Taxable securities 41 (4) – – 41 (4)
Tax-exempt securities 288 (1) – – 288 (1)
Total temporarily-impaired held-to-maturity securities 329 (5) – – 329 (5)
Total temporarily-impaired securities $ 60,662 $ (330) $ 17,605 $ (346) $ 78,267 $ (676)
(1) Unrealized losses less than $500,000 are shown as zero.
The unrealized losses associated with U.S. Treasury securities and
agency debentures, mortgage-backed securities, certain foreign sov-
ereign securities, other taxable securities and tax-exempt securities
are not considered to be other-than-temporary because their unreal-
ized losses are related to changes in interest rates and do not affect
the expected cash flows of the underlying collateral or issuer. The
Corporation also has unrealized losses associated with other foreign
sovereign securities; however, these losses are not considered other-
than-temporary because the principal of these securities is guaran-
teed by the U. S. government.
The Corporation had investments in Securities from the Federal
National Mortgage Association (Fannie Mae) and Federal Home Loan
Mortgage Corporation (Freddie Mac) that exceeded 10 percent of con-
solidated Shareholders’ Equity as of December 31, 2004 and 2003.
Those investments had market values of $133.6 billion and $35.8
billion, respectively, at December 31, 2004 and $36.6 billion and
$5.9 billion, respectively, as of December 31, 2003. In addition,
these investments had total amortized costs of $132.9 billion and
$35.9 billion, respectively, as of December 31, 2004 and $37.1 bil-
lion and $6.0 billion, respectively, as of December 31, 2003.
Securities are pledged or assigned to secure borrowed funds,
government and trust deposits, and for other purposes. The carrying
value of pledged Securities was $45.1 billion and $20.9 billion at
December 31, 2004 and 2003, respectively.
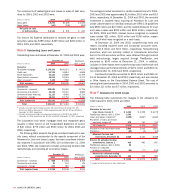
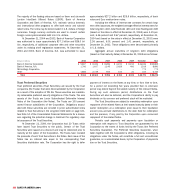
The contractual maturity distribution and yields of the
Corporation’s securities portfolio at December 31, 2004 are
summarized in the following table. Actual maturities may differ
from the contractual or expected maturities shown below since
borrowers may have the right to prepay obligations with or without
prepayment penalties.
marketable equity securities at December 31, 2004 were not con-
sidered material. The table also discloses whether these securities
have had unrealized losses for less than 12 months, or for 12
months or longer.
Due after 1 Due after 5
Due in 1 year year through 5 years through Due after
or less years 10 years 10 years(1) Total
(Dollars in millions) Amount Yield(2) Amount Yield(2) Amount Yield(2) Amount Yield(2) Amount Yield(2)
Fair value of available-for-sale securities
U.S. Treasury securities and agency debentures $ 101 1.94% $ 576 3.04% $ 131 3.86% $ 17 5.40% $ 825 3.09%
Mortgage-backed securities 4 2.15 91,665 5.08 65,622 5.31 15,956 5.51 173,247 5.21
Foreign sovereign securities 757 4.90 1,377 2.46 1,799 3.04 3,514 3.98 7,447 3.56
Other taxable securities 140 2.90 2,614 3.56 2,877 4.98 3,849 5.56 9,480 4.81
■■■■■■■■■■■■■■■■■■■ ■■■■■■■■■■■■■■■■■■■ ■■■■■■■■■■■■■■■■■■■ ■■■■■■■■■■■■■■■■■■■ ■■■■■■■■■■■■■■
Total taxable 1,002 4.31 96,232 4.99 70,429 5.23 23,336 5.29 190,999 5.11
Tax-exempt securities(3) 924 2.55 181 4.52 1,554 6.11 1,085 6.54 3,744 5.28
■■■■■■■■■■■■■■■■■■■ ■■■■■■■■■■■■■■■■■■■ ■■■■■■■■■■■■■■■■■■■ ■■■■■■■■■■■■■■■■■■■ ■■■■■■■■■■■■■■
Total available-for-sale securities $ 1,926 3.47% $ 96,413 4.99% $ 71,983 5.25% $ 24,421 5.34% $ 194,743 5.12%
Amortized cost of available-for-sale securities $ 1,926 $ 96,439 $ 72,010 $ 24,740 $ 195,115
Amortized cost of held-to-maturity securities
Taxable securities $ 41 2.30% $ – –% $ – –% $ – –% $ 41 2.30%
Tax-exempt securities(3) 258 1.72 26 2.70 4 4.37 1 0.26 289 1.85
■■■■■■■■■■■■■■■■■■■ ■■■■■■■■■■■■■■■■■■■ ■■■■■■■■■■■■■■■■■■■ ■■■■■■■■■■■■■■■■■■■ ■■■■■■■■■■■■■■
Total held-to-maturity securities $ 299 1.80% $ 26 2.70% $ 4 4.37% $ 1 0.26% $ 330 1.90%
Fair value of held-to-maturity securities $ 298 $ 26 $ 4 $ 1 $ 329
(1) Includes securities with no stated maturity.
(2) Yields are calculated based on the amortized cost of the securities.
(3) Yield of tax-exempt securities calculated on a fully taxable-equivalent basis.