Bank of America 2004 Annual Report Download - page 41
Download and view the complete annual report
Please find page 41 of the 2004 Bank of America annual report below. You can navigate through the pages in the report by either clicking on the pages listed below, or by using the keyword search tool below to find specific information within the annual report.-
 1
1 -
2
-
3
-
4
-
5
-
6
-
7
-
8
-
9
-
10
-
11
-
12
-
13
-
14
-
15
-
16
-
17
-
18
-
19
-
20
-
21
-
22
-
23
-
24
-
25
-
26
-
27
-
28
-
29
-
30
-
 31
31 -
 32
32 -
 33
33 -
 34
34 -
 35
35 -
 36
36 -
 37
37 -
 38
38 -
 39
39 -
 40
40 -
 41
41 -
 42
42 -
 43
43 -
 44
44 -
 45
45 -
 46
46 -
 47
47 -
 48
48 -
 49
49 -
 50
50 -
 51
51 -
52
-
53
-
54
-
55
-
56
-
57
-
58
-
59
-
60
-
61
-
62
-
63
-
64
-
65
-
66
-
67
-
68
-
69
-
70
-
71
-
72
-
73
-
74
-
75
-
76
-
77
-
78
-
79
-
80
-
81
-
82
-
83
-
84
-
85
-
86
-
87
-
88
-
89
-
90
-
91
-
92
-
93
-
94
-
95
-
96
-
97
-
98
-
99
-
100
-
101
-
102
-
103
-
104
-
105
-
106
-
107
-
108
-
109
-
110
-
111
-
112
-
113
-
114
-
115
-
116
-
117
-
118
-
119
-
120
-
121
-
122
-
123
-
124
-
125
-
126
-
127
-
128
-
129
-
130
-
131
-
132
-
133
-
134
-
135
-
136
-
137
-
138
-
139
-
140
-
141
-
142
-
143
-
144
-
145
-
146
-
147
-
148
-
149
-
150
-
151
-
152
-
153
-
154
 |
 |

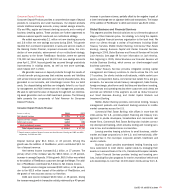
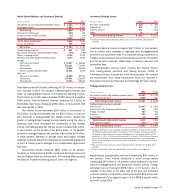
Core Net Interest Income
In addition, we review core net interest income which adjusts reported
Net Interest Income on a FTE basis for the impact of trading-related
activities. As discussed in the Global Capital Markets and Investment
Banking business segment section beginning on page 46, we evaluate
our trading results and strategies based on total trading-related rev-
enue, calculated by combining trading-related Net Interest Income with
Trading Account Profits. We also adjust for loans that we originated and
sold into revolving credit card, home equity line and commercial loan
securitizations. Noninterest Income, rather than Net Interest Income
and Provision for Credit Losses, is recorded for assets that have been
securitized as we are compensated for servicing the securitized assets
and record servicing income and gains or losses on securitizations,
where appropriate. An analysis of core net interest income, earning
assets and yields, which excludes these two non-core items from
reported Net Interest Income on a FTE basis, is shown below.
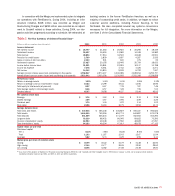
Table 3
Core Net Interest Income
(Dollars in millions) 2004 2003 2002
Net interest income
As reported
(fully taxable-equivalent basis) $ 29,513 $ 22,107 $ 21,511
Trading-related net interest income (2,039) (2,239) (1,977)
Impact of revolving securitizations 931 313 517
Core net interest income $ 28,405 $ 20,181 $ 20,051
Average earning assets
As reported $ 905,302 $ 649,548 $ 570,530
Trading-related earning assets (227,861) (172,825) (121,291)
Impact of revolving securitizations 10,181 3,342 5,943
Core average earning assets $ 687,622 $ 480,065 $ 455,182
Net interest yield on earning assets
As reported
(fully taxable-equivalent basis) 3.26% 3.40% 3.77%
Impact of trading-related activities 0.80 0.76 0.58
Impact of revolving securitizations 0.06 0.03 0.05
Core net interest yield on
earning assets 4.12% 4.19% 4.40%
Core net interest income increased $8.2 billion for 2004. Approximately
half of the increase was due to the Merger. Other activities within the
portfolio affecting core net interest income were higher ALM portfolio lev-
els, the impact of higher rates, higher consumer loan levels (primarily
credit card loans and home equity lines) and higher core deposit fund-
ing levels, partially offset by reductions in the large corporate and foreign
loan balances, and lower mortgage warehouse levels.
Core average earning assets increased $207.6 billion primarily
due to higher ALM levels, (primarily securities and mortgages) and
higher levels of consumer loans (primarily credit card loans and home
equity lines). The increases in these assets were due to both the
Merger and organic growth.
The core net interest yield decreased seven bps due to the
impact of ALM portfolio repositioning, partially offset by the impact of
higher levels of consumer loans and core deposits.
Business Segment Operations
Segment Description
In connection with the Merger, we realigned our business segment
reporting to reflect the new business model of the combined company.
As a part of this realignment, the segment formerly reported as
Consumer and Commercial Banking was split into two new segments,
Global Consumer and Small Business Banking and Global Business and
Financial Services. We have repositioned Asset Management as Global
Wealth and Investment Management, which now includes Premier
Banking. Premier Banking was included in Consumer and Commercial
Banking in the past, and is made up of our affluent retail customers.
This will enable us to serve our customers with a diverse offering of
wealth management products. Global Capital Markets and Investment
Banking remained relatively unchanged, with the exception of moving
the commercial leasing business to Global Business and Financial
Services, and Latin America moving to All Other. All Other consists
primarily of Latin America, the former Equity Investments segment,
Noninterest Income and Expense amounts associated with the ALM
process, including Gains on Sales of Debt Securities, the allowance
for credit losses process, the residual impact of methodology allocations,
intersegment eliminations, and the results of certain consumer
finance and commercial lending businesses that are being liquidated.
Basis of Presentation
We prepare and evaluate segment results using certain non-GAAP
methodologies and performance measures many of which were dis-
cussed in Supplemental Financial Data on page 38. The starting
point in evaluating results is the operating results of the businesses,
which by definition excludes Merger and Restructuring Charges. The
segment results also reflect certain revenue and expense method-
ologies, which are utilized to determine operating income. The Net
Interest Income of the business segments includes the results of a
funds transfer pricing process that matches assets and liabilities
with similar interest rate sensitivity and maturity characteristics. Net
Interest Income also reflects an allocation of Net Interest Income
generated by assets and liabilities used in our ALM process. The
results of business segments will fluctuate based on the perform-
ance of corporate ALM activities.
Certain expenses not directly attributable to a specific business
segment are allocated to the segments based on pre-determined
means. The most significant of these expenses include data pro-
cessing costs, item processing costs and certain centralized or
shared functions. Data processing costs are allocated to the seg-
ments based on equipment usage. Item processing costs are allo-
cated to the segments based on the volume of items processed for
each segment. The costs of certain centralized or shared functions
are allocated based on methodologies which reflect utilization.
40 BANK OF AMERICA 2004