Bank of America 2004 Annual Report Download - page 148
Download and view the complete annual report
Please find page 148 of the 2004 Bank of America annual report below. You can navigate through the pages in the report by either clicking on the pages listed below, or by using the keyword search tool below to find specific information within the annual report.-
 1
1 -
2
-
3
-
4
-
5
-
6
-
7
-
8
-
9
-
10
-
11
-
12
-
13
-
14
-
15
-
16
-
17
-
18
-
19
-
20
-
21
-
22
-
23
-
24
-
25
-
26
-
27
-
28
-
29
-
30
-
31
-
32
-
33
-
34
-
35
-
36
-
37
-
38
-
39
-
40
-
41
-
42
-
43
-
44
-
45
-
46
-
47
-
48
-
49
-
50
-
51
-
52
-
53
-
54
-
55
-
56
-
57
-
58
-
59
-
60
-
61
-
62
-
63
-
64
-
65
-
66
-
67
-
68
-
69
-
70
-
71
-
72
-
73
-
74
-
75
-
76
-
77
-
78
-
79
-
80
-
81
-
82
-
83
-
84
-
85
-
86
-
87
-
88
-
89
-
90
-
91
-
92
-
93
-
94
-
95
-
96
-
97
-
98
-
99
-
100
-
101
-
102
-
103
-
104
-
105
-
106
-
107
-
108
-
109
-
110
-
111
-
112
-
113
-
114
-
115
-
116
-
117
-
118
-
119
-
120
-
121
-
122
-
123
-
124
-
125
-
126
-
127
-
128
-
129
-
130
-
131
-
132
-
133
-
134
-
135
-
136
-
137
-
 138
138 -
 139
139 -
 140
140 -
 141
141 -
 142
142 -
 143
143 -
 144
144 -
 145
145 -
 146
146 -
 147
147 -
 148
148 -
 149
149 -
 150
150 -
 151
151 -
 152
152 -
 153
153 -
 154
154
 |
 |

BANK OF AMERICA 2004 147
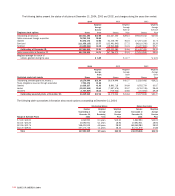
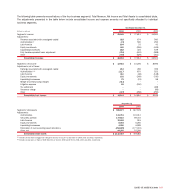
The following table presents reconciliations of the four business segments’ Total Revenue, Net Income and Total Assets to consolidated totals.
The adjustments presented in the table below include consolidated income and expense amounts not specifically allocated to individual
business segments.
Year Ended December 31
(Dollars in millions) 2004 2003 2002
Segments’ revenue $ 48,546 $ 37,811 $ 34,561
Adjustments:
Revenue associated with unassigned capital 318 674 560
ALM activities(1) (74) 500 294
Latin America 834 33 43
Equity investments 440 (256) (445)
Liquidating businesses 282 324 539
Fully taxable-equivalent basis adjustment (716) (643) (588)
Other (736) (529) (461)
Consolidated revenue $ 48,894 $ 37,914 $ 34,503
Segments’ net income $ 12,915 $ 10,205 $ 8,595
Adjustments, net of taxes:
Earnings associated with unassigned capital 212 459 399
ALM activities(1,2) 1,117 870 523
Latin America 310 (48) (148)
Equity investments 192 (249) (330)
Liquidating businesses 79 (19) 58
Merger and restructuring charges (411) ––
Litigation expense 66 (150) –
Tax settlement –– 488
Severance charge –– (86)
Other (337) (258) (250)
Consolidated net income $ 14,143 $ 10,810 $ 9,249
December 31
2004 2003
Segments’ total assets $ 985,877 $ 667,578
Adjustments:
ALM activities 131,751 103,313
Securities portfolio 177,803 59,333
Latin America 12,402 515
Equity investments 8,064 6,250
Liquidating businesses 4,390 6,528
Elimination of excess earning asset allocations (254,225) (177,303)
Other, net 44,395 53,269
Consolidated total assets $ 1,110,457 $ 719,483
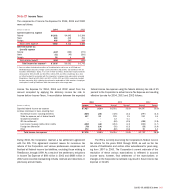
(1) Includes pre-tax whole mortgage loan sale gains/(losses) of $(2), $772 and $500 for 2004, 2003 and 2002, respectively.
(2) Includes pre-tax Gains on Sales of Debt Securities of $2,011, $938 and $701 for 2004, 2003 and 2002, respectively.