Bank of America 2004 Annual Report Download - page 45
Download and view the complete annual report
Please find page 45 of the 2004 Bank of America annual report below. You can navigate through the pages in the report by either clicking on the pages listed below, or by using the keyword search tool below to find specific information within the annual report.-
 1
1 -
2
-
3
-
4
-
5
-
6
-
7
-
8
-
9
-
10
-
11
-
12
-
13
-
14
-
15
-
16
-
17
-
18
-
19
-
20
-
21
-
22
-
23
-
24
-
25
-
26
-
27
-
28
-
29
-
30
-
31
-
32
-
33
-
34
-
 35
35 -
 36
36 -
 37
37 -
 38
38 -
 39
39 -
 40
40 -
 41
41 -
 42
42 -
 43
43 -
 44
44 -
 45
45 -
 46
46 -
 47
47 -
 48
48 -
 49
49 -
 50
50 -
 51
51 -
 52
52 -
 53
53 -
 54
54 -
 55
55 -
56
-
57
-
58
-
59
-
60
-
61
-
62
-
63
-
64
-
65
-
66
-
67
-
68
-
69
-
70
-
71
-
72
-
73
-
74
-
75
-
76
-
77
-
78
-
79
-
80
-
81
-
82
-
83
-
84
-
85
-
86
-
87
-
88
-
89
-
90
-
91
-
92
-
93
-
94
-
95
-
96
-
97
-
98
-
99
-
100
-
101
-
102
-
103
-
104
-
105
-
106
-
107
-
108
-
109
-
110
-
111
-
112
-
113
-
114
-
115
-
116
-
117
-
118
-
119
-
120
-
121
-
122
-
123
-
124
-
125
-
126
-
127
-
128
-
129
-
130
-
131
-
132
-
133
-
134
-
135
-
136
-
137
-
138
-
139
-
140
-
141
-
142
-
143
-
144
-
145
-
146
-
147
-
148
-
149
-
150
-
151
-
152
-
153
-
154
 |
 |

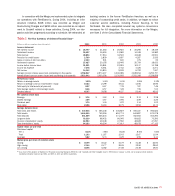
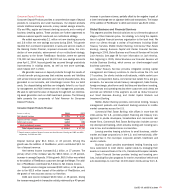
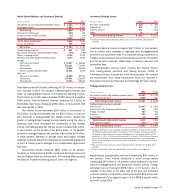
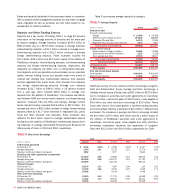
Mortgage Banking Income decreased from $2.1 billion in 2003
to $595 million. The following summarizes the components of
Mortgage Banking Income. Mortgage Banking Income includes the
performance of loans sold in the secondary market and the performance
of the servicing portfolio.
Mortgage Banking Income
(Dollars in millions) 2004 2003
Production income $ 771 $ 1,927
Servicing income:
Servicing fees and ancillary income 614 348
Amortization of MSRs (345) (135)
Net MSR and SFAS 133 derivative
hedge adjustments(1) 18 –
Impairment of MSRs (463) –
Total net servicing income (176) 213
Total mortgage banking income $ 595 $ 2,140
(1) Represents derivative hedge gains of $228, offset by a decrease in the value of the MSRs
under SFAS 133 hedges of $210 for 2004. See Note 8 of the Consolidated Financial Statements.
The decrease in Mortgage Banking Income was primarily driven by a
decline in the size of the first mortgage production market from the
record levels of 2003. In 2004, we produced $87.5 billion residential
first mortgages compared to $131.1 billion in the prior year. Of the
2004 volume, $57.5 billion was originated through retail channels
and $30.0 billion was originated in our wholesale channel. This com-
pares to 2003 with $91.8 billion originated through retail channels
and $39.3 billion originated through wholesale channels. During
2004, approximately 58 percent of the production was refinance activ-
ity compared to 84 percent in 2003. Additionally, the market and cus-
tomer preference has shifted the mix of fixed rate loans to 64 percent
in 2004, down from 80 percent in 2003. The decline in the size of the
market, excess industry capacity, and the rising interest rate environ-
ment also resulted in decreased operating margins. The volume reduc-
tions resulted in lower loan sales to the secondary market, which
totaled $69.4 billion, a 35 percent decrease from the prior year.
During 2004, impairment charges totaled $463 million, includ-
ing a $261 million adjustment for changes in valuation assumptions
and prepayment adjustments to align with changing market condi-
tions and customer behavioral trends. As an economic hedge to the
changes associated with the value of MSRs, a combination of deriv-
atives and AFS securities (e.g. mortgage-backed securities) was uti-
lized. During 2004, Consumer Real Estate realized $117 million in
Gains on Sales of Debt Securities and $65 million of Net Interest
Income from Securities used as an economic hedge of MSRs. At
December 31, 2004, $564 million in MSRs were covered by these
economic hedges. The remaining $1.8 billion in MSRs were hedged
using a SFAS No. 133, “Accounting for Derivative Instruments and
Hedging Activities” (SFAS 133) strategy.
Additionally, contributing to Consumer Real Estate revenue,
Trading Account Profits decreased by $190 million. Prior to conversion
of the Certificates to MSRs in June 2004, changes in the value of the
Certificates, MSRs and derivatives used for risk management were
recognized as Trading Account Profits. Trading Account Profits
included $342 million and $310 million of downward adjustments for
changes to valuation assumptions and prepayment adjustments in
2004 and 2003, respectively. For more information on the conversion,
see Note 1 of the Consolidated Financial Statements.
Other income includes premiums collected through our mortgage
insurance captive and other miscellaneous revenue items.
Servicing income is recognized when cash is received for per-
forming servicing activities for others. Servicing activities primarily
include collecting cash for principal, interest and escrow payments
from borrowers, and accounting for and remitting principal and inter-
est payments to investors of mortgage-backed securities. Servicing
income also includes any ancillary income, such as late fees, derived
in connection with these activities. The servicing portfolio includes
originated and retained residential mortgages, loans serviced for
others and home equity loans. As discussed more fully below, the
servicing portfolio ended 2004 at $332.5 billion, an increase of
$57.4 billion from December 31, 2003. The addition of FleetBoston
customers contributed $33.8 billion of this increase.
We recognize an intangible asset for the MSRs, which repre-
sents the right to perform specified residential mortgage servicing
activities for others. The amount capitalized as MSRs represents the
current fair value of future net cash flows expected to be realized for
performing servicing activities. MSRs are amortized as a reduction of
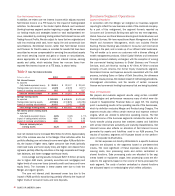
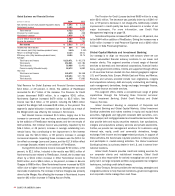
actual servicing income received. The following table outlines statistical
information on the MSRs:
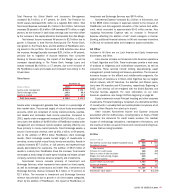
Mortgage Servicing Rights
December 31
(Dollars in millions) 2004 2003
MSR data:
Balance(1,2) $ 2,359 $ 2,684
Capitalization rate 1.19% 1.47%
Unpaid balance(3) $ 197,795 $183,116
Number of customers (in thousands) 1,582 1,586
(1) MSRs outside of Global Consumer and Small Business Banking at December 31, 2004 and 2003
were $123 and $78, respectively, in Global Capital Markets and Investment Banking.
(2) Includes $2,283 of Certificates at December 31, 2003. For more information on the Certificates,
see Note 1 of the Consolidated Financial Statements.
(3) Represents only loans serviced for others.
As of December 31, 2004, the MSR balance was $2.4 billion, or 12
percent lower than at the end of 2003. This value represented 119
bps as a percent of the related unpaid principal balance, a 19 percent
decrease from 2003. For more information on MSRs, see Notes 1
and 8 of the Consolidated Financial Statements.
44 BANK OF AMERICA 2004