Bank of America 2004 Annual Report Download - page 83
Download and view the complete annual report
Please find page 83 of the 2004 Bank of America annual report below. You can navigate through the pages in the report by either clicking on the pages listed below, or by using the keyword search tool below to find specific information within the annual report.-
 1
1 -
2
-
3
-
4
-
5
-
6
-
7
-
8
-
9
-
10
-
11
-
12
-
13
-
14
-
15
-
16
-
17
-
18
-
19
-
20
-
21
-
22
-
23
-
24
-
25
-
26
-
27
-
28
-
29
-
30
-
31
-
32
-
33
-
34
-
35
-
36
-
37
-
38
-
39
-
40
-
41
-
42
-
43
-
44
-
45
-
46
-
47
-
48
-
49
-
50
-
51
-
52
-
53
-
54
-
55
-
56
-
57
-
58
-
59
-
60
-
61
-
62
-
63
-
64
-
65
-
66
-
67
-
68
-
69
-
70
-
71
-
72
-
 73
73 -
 74
74 -
 75
75 -
 76
76 -
 77
77 -
 78
78 -
 79
79 -
 80
80 -
 81
81 -
 82
82 -
 83
83 -
 84
84 -
 85
85 -
 86
86 -
 87
87 -
 88
88 -
 89
89 -
 90
90 -
 91
91 -
 92
92 -
 93
93 -
94
-
95
-
96
-
97
-
98
-
99
-
100
-
101
-
102
-
103
-
104
-
105
-
106
-
107
-
108
-
109
-
110
-
111
-
112
-
113
-
114
-
115
-
116
-
117
-
118
-
119
-
120
-
121
-
122
-
123
-
124
-
125
-
126
-
127
-
128
-
129
-
130
-
131
-
132
-
133
-
134
-
135
-
136
-
137
-
138
-
139
-
140
-
141
-
142
-
143
-
144
-
145
-
146
-
147
-
148
-
149
-
150
-
151
-
152
-
153
-
154
 |
 |

82 BANK OF AMERICA 2004
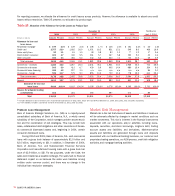
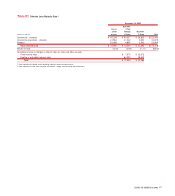
Gains on Sales of Debt Securities
Gains on Sales of Debt Securities in 2003 and 2002, were $941 million
and $630 million, respectively, as we continued to reposition the ALM
portfolio in response to interest rate fluctuations.
Provision for Credit Losses
The Provision for Credit Losses declined $858 million to $2.8 billion in
2003 due to an improvement in the commercial portfolio partially off-
set by a stable but growing consumer portfolio. This improvement was
driven by reduced levels of inflows to nonperforming assets in Global
Capital Markets and Investment Banking, together with loan sales and
payoffs facilitated by high levels of liquidity in the capital markets.
Noninterest Expense
Noninterest Expense increased $1.7 billion in 2003 from 2002,
driven by higher personnel costs, increased Professional Fees includ-
ing legal expense and increased Marketing Expense. Higher person-
nel costs resulted from increased costs of employee benefits of
$504 million and revenue-related incentives of $435 million.
Employee benefits expense increased due to stock option expense of
$120 million in 2003 and the impacts of a change in the expected
long-term rates of return on plan assets to 8.5 percent for 2003 from
9.5 percent in 2002 and a change in the discount rate to 6.75 per-
cent in 2003 from 7.25 percent in 2002 for the Bank of America
Pension Plan. The increase in Professional Fees of $319 million was
driven by an increase in litigation accruals of $220 million associated
with pending litigation principally related to securities matters.
Marketing Expense increased by $232 million due to higher advertis-
ing costs, as well as marketing investments in direct marketing for
the credit card business. In addition, recorded in other expense dur-
ing 2003 was a $100 million charge related to issues surrounding
our mutual fund practices.
Income Tax Expense
Income Tax Expense was $5.1 billion, reflecting an effective tax rate
of 31.8 percent, in 2003 compared to $3.7 billion and 28.8 percent,
respectively, in 2002. The 2002 effective tax rate was impacted by a
$488 million reduction in Income Tax Expense resulting from a set-
tlement with the IRS generally covering tax years ranging from 1984
to 1999 but including tax returns as far back as 1971.
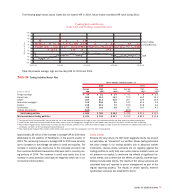
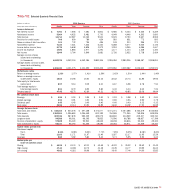
Business Segment Operations
Global Consumer and Small Business Banking
Total Revenue increased $2.6 billion, or 14 percent, in 2003 compared
to 2002. Overall deposit and loan growth contributed to the $703 million,
or six percent, increase in Net Interest Income. This increase was off-
set by the compression of deposit interest margins and the results of
ALM activities. Increases in Mortgage Banking Income of 118 percent,
Service Charges of 14 percent and Card Income of 17 percent drove
the $1.9 billion, or 28 percent, increase in Noninterest Income.
These increases were offset by a decrease in Trading Account Profits.
Net Income rose $965 million, or 20 percent, due to the increases in
Net Interest Income and Noninterest Income discussed above, offset
by an increase in the Provision for Credit Losses. Higher provision in
the credit card loan portfolio, offset by a decline in provision for other
consumer loans resulted in a $157 million, or 10 percent, increase
in the Provision for Credit Losses.
Global Business and Financial Services
Total Revenue increased $108 million, or two percent, in 2003
compared to 2002. Net Interest Income decreased $77 million, or
two percent. Increases in Other Noninterest Income of 58 percent,
Service Charges of seven percent and Investment Banking Income of
seven percent drove the $185 million, or 15 percent, increase in
Noninterest Income. These increases were offset by a decrease in
Trading Account Profits. Provision for Credit Losses remained rela-
tively flat. Net Income rose $102 million, or seven percent, due to the
increase in Noninterest Income discussed above, offset by the
decrease in Net Interest Income.