Bank of America 2005 Annual Report Download - page 100
Download and view the complete annual report
Please find page 100 of the 2005 Bank of America annual report below. You can navigate through the pages in the report by either clicking on the pages listed below, or by using the keyword search tool below to find specific information within the annual report.-
 1
1 -
2
-
3
-
4
-
5
-
6
-
7
-
8
-
9
-
10
-
11
-
12
-
13
-
14
-
15
-
16
-
17
-
18
-
19
-
20
-
21
-
22
-
23
-
24
-
25
-
26
-
27
-
28
-
29
-
30
-
31
-
32
-
33
-
34
-
35
-
36
-
37
-
38
-
39
-
40
-
41
-
42
-
43
-
44
-
45
-
46
-
47
-
48
-
49
-
50
-
51
-
52
-
53
-
54
-
55
-
56
-
57
-
58
-
59
-
60
-
61
-
62
-
63
-
64
-
65
-
66
-
67
-
68
-
69
-
70
-
71
-
72
-
73
-
74
-
75
-
76
-
77
-
78
-
79
-
80
-
81
-
82
-
83
-
84
-
85
-
86
-
87
-
88
-
89
-
 90
90 -
 91
91 -
 92
92 -
 93
93 -
 94
94 -
 95
95 -
 96
96 -
 97
97 -
 98
98 -
 99
99 -
 100
100 -
 101
101 -
 102
102 -
 103
103 -
 104
104 -
 105
105 -
 106
106 -
 107
107 -
 108
108 -
 109
109 -
 110
110 -
111
-
112
-
113
-
114
-
115
-
116
-
117
-
118
-
119
-
120
-
121
-
122
-
123
-
124
-
125
-
126
-
127
-
128
-
129
-
130
-
131
-
132
-
133
-
134
-
135
-
136
-
137
-
138
-
139
-
140
-
141
-
142
-
143
-
144
-
145
-
146
-
147
-
148
-
149
-
150
-
151
-
152
-
153
-
154
-
155
-
156
-
157
-
158
-
159
-
160
-
161
-
162
-
163
-
164
-
165
-
166
-
167
-
168
-
169
-
170
-
171
-
172
-
173
-
174
-
175
-
176
-
177
-
178
-
179
-
180
-
181
-
182
-
183
-
184
-
185
-
186
-
187
-
188
-
189
-
190
-
191
-
192
-
193
-
194
-
195
-
196
-
197
-
198
-
199
-
200
-
201
-
202
-
203
-
204
-
205
-
206
-
207
-
208
-
209
-
210
-
211
-
212
-
213
 |
 |

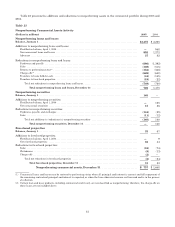
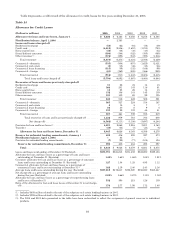
Table 24 presents a rollforward of the allowance for credit losses for five years ending December 31, 2005.
Table 24
Allowance for Credit Losses
(Dollars in millions) 2005 2004 2003 2002 2001
Allowance for loan and lease losses, January 1 ...................... $ 8,626 $ 6,163 $ 6,358 $ 6,278 $ 6,365
FleetBoston balance, April 1, 2004 .................................. —2,763 — — —
Loans and leases charged off
Residential mortgage ................................................. (58) (62) (64) (56) (39)
Creditcard.......................................................... (4,018) (2,536) (1,657) (1,210) (753)
Homeequitylines.................................................... (46) (38) (38) (40) (32)
Direct/Indirect consumer .............................................. (380) (344) (322) (355) (389)
Other consumer(1) .................................................... (376) (295) (343) (395) (1,216)
Total consumer .................................................. (4,878) (3,275) (2,424) (2,056) (2,429)
Commercial—domestic ............................................... (535) (504) (857) (1,625) (2,021)
Commercial real estate ............................................... (5) (12) (46) (45) (46)
Commercial lease financing ........................................... (315) (39) (132) (168) (99)
Commercial—foreign ................................................. (61) (262) (408) (566) (249)
Total commercial ................................................. (916) (817) (1,443) (2,404) (2,415)
Total loans and leases charged off .............................. (5,794) (4,092) (3,867) (4,460) (4,844)
Recoveries of loans and leases previously charged off
Residential mortgage ................................................. 31 26 24 14 13
Creditcard.......................................................... 366 231 143 116 81
Homeequitylines.................................................... 15 23 26 14 13
Direct/Indirect consumer .............................................. 132 136 141 145 139
Other consumer ..................................................... 101 102 88 99 135
Total consumer .................................................. 645 518 422 388 381
Commercial—domestic ............................................... 365 327 224 314 167
Commercial real estate ............................................... 515 5 7 7
Commercial lease financing ........................................... 84 30 8 9 4
Commercial—foreign ................................................. 133 89 102 45 41
Total commercial ................................................. 587 461 339 375 219
Total recoveries of loans and leases previously charged off ......... 1,232 979 761 763 600
Netcharge-offs ........................................... (4,562) (3,113) (3,106) (3,697) (4,244)
Provision for loan and lease losses(2) .................................... 4,021 2,868 2,916 3,801 4,163
Transfers ........................................................... (40) (55) (5) (24) (6)
Allowance for loan and lease losses, December 31 ............... 8,045 8,626 6,163 6,358 6,278
Reserve for unfunded lending commitments, January 1 ............. 402 416 493 597 473
FleetBoston balance, April 1, 2004 .................................. —85———
Provision for unfunded lending commitments ............................ (7) (99) (77) (104) 124
Reserve for unfunded lending commitments, December 31 ........ 395 402 416 493 597
Total ........................................................... $ 8,440 $ 9,028 $ 6,579 $ 6,851 $ 6,875
Loans and leases outstanding at December 31 (Restated) .................. $573,791 $521,813 $371,433 $342,890 $329,153
Allowance for loan and lease losses as a percentage of loans and leases
outstanding at December 31 (Restated) ............................... 1.40% 1.65% 1.66% 1.85% 1.91%
Consumer allowance for loan and lease losses as a percentage of consumer
loans and leases outstanding at December 31 (Restated) (3) .............. 1.27 1.34 1.25 0.95 1.12
Commercial allowance for loan and lease losses as a percentage of
commercial loans and leases outstanding at December 31(3) .............. 1.62 2.19 2.40 2.43 2.16
Average loans and leases outstanding during the year (Restated) ........... $537,218 $472,617 $356,220 $336,820 $365,447
Net charge-offs as a percentage of average loans and leases outstanding
during the year (Restated) .......................................... 0.85% 0.66% 0.87% 1.10% 1.16%
Allowance for loan and lease losses as a percentage of nonperforming loans
and leases at December 31 .......................................... 532 390 215 126 139
Ratio of the allowance for loan and lease losses at December 31 to net charge-
offs............................................................... 1.76 2.77 1.98 1.72 1.48
(1) Includes $635 million related to the exit of the subprime real estate lending business in 2001.
(2) Includes $395 million related to the exit of the subprime real estate lending business in 2001.
(3) The 2004 and 2003 data presented in the table have been reclassified to reflect the assignment of general reserves to individual
products.
64