Bank of America 2005 Annual Report Download - page 186
Download and view the complete annual report
Please find page 186 of the 2005 Bank of America annual report below. You can navigate through the pages in the report by either clicking on the pages listed below, or by using the keyword search tool below to find specific information within the annual report.-
 1
1 -
2
-
3
-
4
-
5
-
6
-
7
-
8
-
9
-
10
-
11
-
12
-
13
-
14
-
15
-
16
-
17
-
18
-
19
-
20
-
21
-
22
-
23
-
24
-
25
-
26
-
27
-
28
-
29
-
30
-
31
-
32
-
33
-
34
-
35
-
36
-
37
-
38
-
39
-
40
-
41
-
42
-
43
-
44
-
45
-
46
-
47
-
48
-
49
-
50
-
51
-
52
-
53
-
54
-
55
-
56
-
57
-
58
-
59
-
60
-
61
-
62
-
63
-
64
-
65
-
66
-
67
-
68
-
69
-
70
-
71
-
72
-
73
-
74
-
75
-
76
-
77
-
78
-
79
-
80
-
81
-
82
-
83
-
84
-
85
-
86
-
87
-
88
-
89
-
90
-
91
-
92
-
93
-
94
-
95
-
96
-
97
-
98
-
99
-
100
-
101
-
102
-
103
-
104
-
105
-
106
-
107
-
108
-
109
-
110
-
111
-
112
-
113
-
114
-
115
-
116
-
117
-
118
-
119
-
120
-
121
-
122
-
123
-
124
-
125
-
126
-
127
-
128
-
129
-
130
-
131
-
132
-
133
-
134
-
135
-
136
-
137
-
138
-
139
-
140
-
141
-
142
-
143
-
144
-
145
-
146
-
147
-
148
-
149
-
150
-
151
-
152
-
153
-
154
-
155
-
156
-
157
-
158
-
159
-
160
-
161
-
162
-
163
-
164
-
165
-
166
-
167
-
168
-
169
-
170
-
171
-
172
-
173
-
174
-
175
-
 176
176 -
 177
177 -
 178
178 -
 179
179 -
 180
180 -
 181
181 -
 182
182 -
 183
183 -
 184
184 -
 185
185 -
 186
186 -
 187
187 -
 188
188 -
 189
189 -
 190
190 -
 191
191 -
 192
192 -
 193
193 -
 194
194 -
 195
195 -
 196
196 -
197
-
198
-
199
-
200
-
201
-
202
-
203
-
204
-
205
-
206
-
207
-
208
-
209
-
210
-
211
-
212
-
213
 |
 |

BANK OF AMERICA CORPORATION AND SUBSIDIARIES
Notes to Consolidated Financial Statements—(Continued)
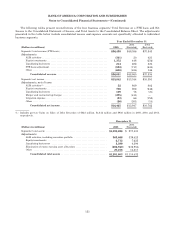
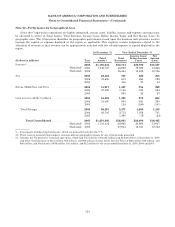
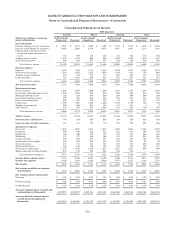
The following table presents Total Revenue on a FTE basis and Net Income in 2005, 2004 and 2003, and Total
Assets at December 31, 2005 and 2004 for each business segment, as well as All Other.
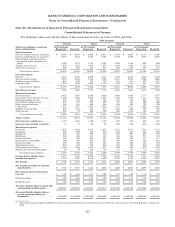
Business Segments
At and for the Year Ended December 31
Total Corporation Global Consumer and
Small Business Banking(1)
(Dollars in millions) 2005 2004
(Restated) 2003
(Restated) 2005 2004 2003
Net interest income (FTE basis) ................... $ 31,569 $ 28,677 $21,149 $ 17,053 $ 15,911 $11,052
Noninterestincome .............................. 25,354 21,005 17,329 11,823 9,245 8,542
Total revenue (FTE basis) .................... 56,923 49,682 38,478 28,876 25,156 19,594
Provision for credit losses ......................... 4,014 2,769 2,839 4,271 3,333 1,694
Gains (losses) on sales of debt securities ............ 1,084 1,724 941 (2) 117 13
Amortization of intangibles ....................... 809 664 217 551 441 139
Other noninterest expense ........................ 27,872 26,348 19,938 12,889 12,114 9,460
Income before income taxes ................... 25,312 21,625 16,425 11,163 9,385 8,314
Income tax expense .............................. 8,847 7,678 5,663 4,007 3,414 2,985
Net income ................................ $ 16,465 $ 13,947 $10,762 $ 7,156 $ 5,971 $ 5,329
Period-end total assets ......................... $1,291,803 $1,110,432 $335,551 $336,902
Global Business
and Financial Services(1)
Global Capital Markets and
Investment Banking(1)
(Dollars in millions) 2005 2004 2003 2005 2004 2003
Net interest income (FTE basis) ................... $ 7,788 $ 6,534 $ 4,253 $ 3,298 $ 4,058 $ 4,233
Noninterestincome .............................. 3,372 2,717 1,613 5,711 4,988 4,118
Total revenue (FTE basis) ............... 11,160 9,251 5,866 9,009 9,046 8,351
Provision for credit losses ......................... (49) (442) 526 (244) (445) 308
Gains (losses) on sales of debt securities ............ 146 —— 117 (10) (14)
Amortization of intangibles ....................... 132 113 30 47 43 24
Other noninterest expense ........................ 4,030 3,485 2,092 6,631 6,538 5,390
Income before income taxes .............. 7,193 6,095 3,218 2,692 2,900 2,615
Income tax expense .............................. 2,631 2,251 1,145 956 976 865
Net income ........................... $ 4,562 $ 3,844 $ 2,073 $ 1,736 $ 1,924 $ 1,750
Period-end total assets ................... $ 237,679 $ 214,045 $395,900 $303,897
Global Wealth and
Investment Management(1) All Other
(Dollars in millions) 2005 2004 2003 2005 2004
(Restated) 2003
(Restated)
Net interest income (FTE basis) ................... $ 3,770 $ 2,869 $ 1,954 $ (340) $ (695) $ (343)
Noninterestincome .............................. 3,623 3,064 2,078 825 991 978
Total revenue (FTE basis) .................... 7,393 5,933 4,032 485 296 635
Provision for credit losses ......................... (5) (20) 11 41 343 300
Gains on sales of debt securities ................... ——— 823 1,617 942
Amortization of intangibles ....................... 74 62 20 554
Other noninterest expense ........................ 3,598 3,369 2,075 724 842 921
Income before income taxes ................... 3,726 2,522 1,926 538 723 352
Income tax expense (benefit) ...................... 1,338 917 687 (85) 120 (19)
Net income ................................ $ 2,388 $ 1,605 $ 1,239 $ 623 $ 603 $ 371
Period-end total assets ......................... $ 127,156 $ 122,587 $195,517 $133,001
(1) There were no material intersegment revenues among the segments.
150