Bank of America 2005 Annual Report Download - page 87
Download and view the complete annual report
Please find page 87 of the 2005 Bank of America annual report below. You can navigate through the pages in the report by either clicking on the pages listed below, or by using the keyword search tool below to find specific information within the annual report.-
 1
1 -
2
-
3
-
4
-
5
-
6
-
7
-
8
-
9
-
10
-
11
-
12
-
13
-
14
-
15
-
16
-
17
-
18
-
19
-
20
-
21
-
22
-
23
-
24
-
25
-
26
-
27
-
28
-
29
-
30
-
31
-
32
-
33
-
34
-
35
-
36
-
37
-
38
-
39
-
40
-
41
-
42
-
43
-
44
-
45
-
46
-
47
-
48
-
49
-
50
-
51
-
52
-
53
-
54
-
55
-
56
-
57
-
58
-
59
-
60
-
61
-
62
-
63
-
64
-
65
-
66
-
67
-
68
-
69
-
70
-
71
-
72
-
73
-
74
-
75
-
76
-
 77
77 -
 78
78 -
 79
79 -
 80
80 -
 81
81 -
 82
82 -
 83
83 -
 84
84 -
 85
85 -
 86
86 -
 87
87 -
 88
88 -
 89
89 -
 90
90 -
 91
91 -
 92
92 -
 93
93 -
 94
94 -
 95
95 -
 96
96 -
 97
97 -
98
-
99
-
100
-
101
-
102
-
103
-
104
-
105
-
106
-
107
-
108
-
109
-
110
-
111
-
112
-
113
-
114
-
115
-
116
-
117
-
118
-
119
-
120
-
121
-
122
-
123
-
124
-
125
-
126
-
127
-
128
-
129
-
130
-
131
-
132
-
133
-
134
-
135
-
136
-
137
-
138
-
139
-
140
-
141
-
142
-
143
-
144
-
145
-
146
-
147
-
148
-
149
-
150
-
151
-
152
-
153
-
154
-
155
-
156
-
157
-
158
-
159
-
160
-
161
-
162
-
163
-
164
-
165
-
166
-
167
-
168
-
169
-
170
-
171
-
172
-
173
-
174
-
175
-
176
-
177
-
178
-
179
-
180
-
181
-
182
-
183
-
184
-
185
-
186
-
187
-
188
-
189
-
190
-
191
-
192
-
193
-
194
-
195
-
196
-
197
-
198
-
199
-
200
-
201
-
202
-
203
-
204
-
205
-
206
-
207
-
208
-
209
-
210
-
211
-
212
-
213
 |
 |

Credit card loans are generally charged off at 180 days past due or 60 days from notification of bankruptcy filing and
are not classified as nonperforming. Unsecured consumer loans and deficiencies in non-real estate secured loans and
leases are charged off at 120 days past due and are generally not classified as nonperforming. Real estate secured
consumer loans are placed on nonaccrual and are classified as nonperforming no later than 90 days past due. The
amount deemed uncollectible on real estate secured loans is charged off at 180 days past due.
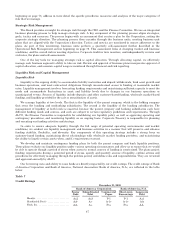
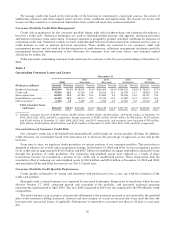
Table 9 presents consumer net charge-offs and net charge-off ratios on the held portfolio for 2005 and 2004.
Table 9
Consumer Net Charge-offs and Net Charge-off Ratios(1)
2005 2004
(Restated)
(Dollars in millions) Amount Percent Amount Percent
Residential mortgage .............................................................. $ 27 0.02% $ 36 0.02%
Creditcard ...................................................................... 3,652 6.76 2,305 5.31
Homeequitylines ................................................................ 31 0.05 15 0.04
Direct/Indirect consumer .......................................................... 248 0.55 208 0.55
Other consumer .................................................................. 275 3.99 193 2.51
Total consumer ............................................................. $4,233 1.26% $2,757 0.93%
(1) Percentage amounts are calculated as net charge-offs divided by average outstanding loans and leases during the year for each loan
category.
As presented in Table 9, consumer net charge-offs from on-balance sheet loans increased $1.5 billion to $4.2 billion
in 2005. Of these increased amounts, $1.3 billion was related to credit card net charge-offs. Higher credit card net
charge-offs were driven by an increase in bankruptcy net charge-offs of $578 million resulting from changes in
bankruptcy legislation, organic portfolio growth and seasoning, increases effective in 2004 in credit card minimum
payment requirements, the impact of the FleetBoston portfolio and new advances on accounts for which previous loan
balances were sold to the securitization trusts. The increase in direct/indirect consumer charge-offs was driven primarily
by the growth and seasoning of the auto loan portfolio. The increase in other consumer charge-offs was primarily driven
by an increase in charge-offs for checking account overdraft balances due to deposit growth and a change in the fourth
quarter of 2005 in our charge-off policy for overdraft balances from 120 days to 60 days.
Net losses for the managed credit card portfolio increased $1.3 billion to $4.1 billion, or 6.92 percent of total average
managed credit card loans in 2005, compared to 5.62 percent of total average managed credit card loans in 2004. Higher
managed credit card net losses were driven by an increase in bankruptcy net losses resulting from the change in
bankruptcy law, continued portfolio growth and seasoning, increases effective in 2004 in credit card minimum payment
requirements and the impact of the FleetBoston portfolio.
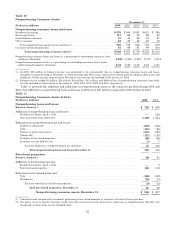
As presented in Table 10, nonperforming consumer assets increased $39 million from December 31, 2004 to $846
million at December 31, 2005. The increase was due to a $47 million increase in nonperforming consumer loans and
leases to $785 million, representing 0.22 percent of outstanding consumer loans and leases at December 31, 2005
compared to $738 million, representing 0.23 percent of outstanding consumer loans and leases at December 31, 2004.
Nonperforming residential mortgages increased $16 million primarily due to modest portfolio growth, partially offset by
sales of $112 million in 2005. Nonperforming home equity lines increased $51 million due to the seasoning of the
portfolio. Other consumer nonperforming loans and leases fell $24 million due to the continued liquidation of the
portfolios in our previously exited consumer businesses and a decline in foreign nonperforming loans and leases. Broad-
based loan growth offset the increase in nonperforming consumer loans resulting in an improvement in the
nonperforming ratios.
51