Bank of America 2005 Annual Report Download - page 125
Download and view the complete annual report
Please find page 125 of the 2005 Bank of America annual report below. You can navigate through the pages in the report by either clicking on the pages listed below, or by using the keyword search tool below to find specific information within the annual report.-
 1
1 -
2
-
3
-
4
-
5
-
6
-
7
-
8
-
9
-
10
-
11
-
12
-
13
-
14
-
15
-
16
-
17
-
18
-
19
-
20
-
21
-
22
-
23
-
24
-
25
-
26
-
27
-
28
-
29
-
30
-
31
-
32
-
33
-
34
-
35
-
36
-
37
-
38
-
39
-
40
-
41
-
42
-
43
-
44
-
45
-
46
-
47
-
48
-
49
-
50
-
51
-
52
-
53
-
54
-
55
-
56
-
57
-
58
-
59
-
60
-
61
-
62
-
63
-
64
-
65
-
66
-
67
-
68
-
69
-
70
-
71
-
72
-
73
-
74
-
75
-
76
-
77
-
78
-
79
-
80
-
81
-
82
-
83
-
84
-
85
-
86
-
87
-
88
-
89
-
90
-
91
-
92
-
93
-
94
-
95
-
96
-
97
-
98
-
99
-
100
-
101
-
102
-
103
-
104
-
105
-
106
-
107
-
108
-
109
-
110
-
111
-
112
-
113
-
114
-
 115
115 -
 116
116 -
 117
117 -
 118
118 -
 119
119 -
 120
120 -
 121
121 -
 122
122 -
 123
123 -
 124
124 -
 125
125 -
 126
126 -
 127
127 -
 128
128 -
 129
129 -
 130
130 -
 131
131 -
 132
132 -
 133
133 -
 134
134 -
 135
135 -
136
-
137
-
138
-
139
-
140
-
141
-
142
-
143
-
144
-
145
-
146
-
147
-
148
-
149
-
150
-
151
-
152
-
153
-
154
-
155
-
156
-
157
-
158
-
159
-
160
-
161
-
162
-
163
-
164
-
165
-
166
-
167
-
168
-
169
-
170
-
171
-
172
-
173
-
174
-
175
-
176
-
177
-
178
-
179
-
180
-
181
-
182
-
183
-
184
-
185
-
186
-
187
-
188
-
189
-
190
-
191
-
192
-
193
-
194
-
195
-
196
-
197
-
198
-
199
-
200
-
201
-
202
-
203
-
204
-
205
-
206
-
207
-
208
-
209
-
210
-
211
-
212
-
213
 |
 |

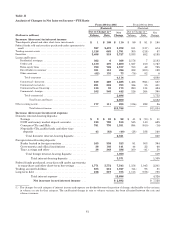
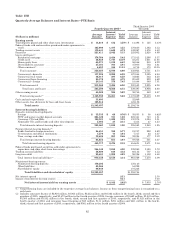
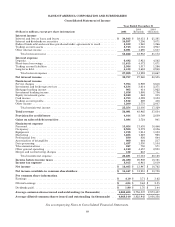
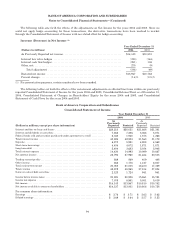
BANK OF AMERICA CORPORATION AND SUBSIDIARIES
Consolidated Statement of Income
Year Ended December 31
(Dollars in millions, except per share information) 2005 2004
(Restated) 2003
(Restated)
Interest income
Interest and fees on loans and leases ......................................... $ 34,843 $ 28,051 $ 21,381
Interest and dividends on securities .......................................... 10,937 7,256 3,071
Federal funds sold and securities purchased under agreements to resell ........... 5,012 1,940 1,266
Trading account assets ..................................................... 5,743 4,016 3,947
Other interest income ...................................................... 2,091 1,690 1,507
Total interest income ................................................... 58,626 42,953 31,172
Interest expense
Deposits .................................................................. 9,492 5,921 4,562
Short-term borrowings ..................................................... 11,615 4,072 1,871
Trading account liabilities .................................................. 2,364 1,317 1,286
Long-term debt ............................................................ 4,418 3,683 2,948
Total interest expense .................................................. 27,889 14,993 10,667
Net interest income ...................................................... 30,737 27,960 20,505
Noninterest income
Servicecharges ........................................................... 7,704 6,989 5,618
Investment and brokerage services ........................................... 4,184 3,614 2,371
Mortgage banking income .................................................. 805 414 1,922
Investment banking income ................................................. 1,856 1,886 1,736
Equity investment gains .................................................... 2,040 863 215
Cardincome .............................................................. 5,753 4,592 3,052
Trading account profits ..................................................... 1,812 869 408
Otherincome ............................................................. 1,200 1,778 2,007
Total noninterest income ............................................... 25,354 21,005 17,329
Total revenue ........................................................... 56,091 48,965 37,834
Provision for credit losses ............................................... 4,014 2,769 2,839
Gains on sales of debt securities .......................................... 1,084 1,724 941
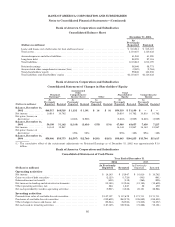
Noninterest expense
Personnel ................................................................ 15,054 13,435 10,446
Occupancy ................................................................ 2,588 2,379 2,006
Equipment ............................................................... 1,199 1,214 1,052
Marketing ................................................................ 1,255 1,349 985
Professional fees .......................................................... 930 836 844
Amortization of intangibles ................................................. 809 664 217
Data processing ........................................................... 1,487 1,330 1,104
Telecommunications ....................................................... 827 730 571
Othergeneraloperating .................................................... 4,120 4,457 2,930
Merger and restructuring charges ........................................... 412 618 —
Total noninterest expense ............................................... 28,681 27,012 20,155
Income before income taxes .............................................. 24,480 20,908 15,781
Income tax expense ...................................................... 8,015 6,961 5,019
Net income .............................................................. $ 16,465 $ 13,947 $ 10,762
Net income available to common shareholders ............................ $ 16,447 $ 13,931 $ 10,758
Per common share information
Earnings ................................................................. $4.10$ 3.71 $ 3.62
Dilutedearnings .......................................................... $4.04$ 3.64 $ 3.55
Dividendspaid ............................................................ $1.90$ 1.70 $ 1.44
Average common shares issued and outstanding (in thousands) ........... 4,008,688 3,758,507 2,973,407
Average diluted common shares issued and outstanding (in thousands) ... 4,068,140 3,823,943 3,030,356
See accompanying Notes to Consolidated Financial Statements.
89