Bank of America 2005 Annual Report Download - page 103
Download and view the complete annual report
Please find page 103 of the 2005 Bank of America annual report below. You can navigate through the pages in the report by either clicking on the pages listed below, or by using the keyword search tool below to find specific information within the annual report.-
 1
1 -
2
-
3
-
4
-
5
-
6
-
7
-
8
-
9
-
10
-
11
-
12
-
13
-
14
-
15
-
16
-
17
-
18
-
19
-
20
-
21
-
22
-
23
-
24
-
25
-
26
-
27
-
28
-
29
-
30
-
31
-
32
-
33
-
34
-
35
-
36
-
37
-
38
-
39
-
40
-
41
-
42
-
43
-
44
-
45
-
46
-
47
-
48
-
49
-
50
-
51
-
52
-
53
-
54
-
55
-
56
-
57
-
58
-
59
-
60
-
61
-
62
-
63
-
64
-
65
-
66
-
67
-
68
-
69
-
70
-
71
-
72
-
73
-
74
-
75
-
76
-
77
-
78
-
79
-
80
-
81
-
82
-
83
-
84
-
85
-
86
-
87
-
88
-
89
-
90
-
91
-
92
-
 93
93 -
 94
94 -
 95
95 -
 96
96 -
 97
97 -
 98
98 -
 99
99 -
 100
100 -
 101
101 -
 102
102 -
 103
103 -
 104
104 -
 105
105 -
 106
106 -
 107
107 -
 108
108 -
 109
109 -
 110
110 -
 111
111 -
 112
112 -
 113
113 -
114
-
115
-
116
-
117
-
118
-
119
-
120
-
121
-
122
-
123
-
124
-
125
-
126
-
127
-
128
-
129
-
130
-
131
-
132
-
133
-
134
-
135
-
136
-
137
-
138
-
139
-
140
-
141
-
142
-
143
-
144
-
145
-
146
-
147
-
148
-
149
-
150
-
151
-
152
-
153
-
154
-
155
-
156
-
157
-
158
-
159
-
160
-
161
-
162
-
163
-
164
-
165
-
166
-
167
-
168
-
169
-
170
-
171
-
172
-
173
-
174
-
175
-
176
-
177
-
178
-
179
-
180
-
181
-
182
-
183
-
184
-
185
-
186
-
187
-
188
-
189
-
190
-
191
-
192
-
193
-
194
-
195
-
196
-
197
-
198
-
199
-
200
-
201
-
202
-
203
-
204
-
205
-
206
-
207
-
208
-
209
-
210
-
211
-
212
-
213
 |
 |
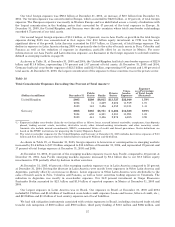
Consolidated Statement of Income, do not include the Net Interest Income recognized on trading positions, or the related
funding charge or benefit. Trading Account Profits can be volatile and are largely driven by general market conditions
and customer demand. Trading Account Profits are dependent on the volume and type of transactions, the level of risk
assumed, and the volatility of price and rate movements at any given time within the ever-changing market
environment.
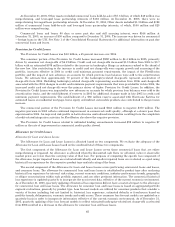
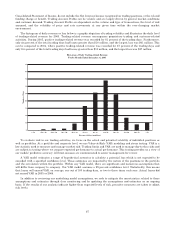
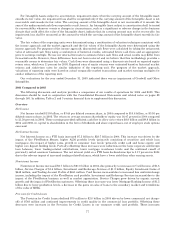
The histogram of daily revenue or loss below is a graphic depiction of trading volatility and illustrates the daily level
of trading-related revenue for 2005. Trading-related revenue encompasses proprietary trading and customer-related
activities. During 2005, positive trading-related revenue was recorded for 81 percent of the trading days. Furthermore,
only six percent of the total trading days had losses greater than $10 million, and the largest loss was $41 million. This
can be compared to 2004, where positive trading-related revenue was recorded for 87 percent of the trading days and
only five percent of the total trading days had losses greater than $10 million, and the largest loss was $27 million.
To evaluate risk in our trading activities, we focus on the actual and potential volatility of individual positions as
well as portfolios. At a portfolio and corporate level, we use Value-at-Risk (VAR) modeling and stress testing. VAR is a
key statistic used to measure and manage market risk. Trading limits and VAR are used to manage day-to-day risks and
are subject to testing where we compare expected performance to actual performance. This testing provides us a view of
our models’ predictive accuracy. All limit excesses are communicated to senior management for review.
A VAR model estimates a range of hypothetical scenarios to calculate a potential loss which is not expected to be
exceeded with a specified confidence level. These estimates are impacted by the nature of the positions in the portfolio
and the correlation within the portfolio. Within any VAR model, there are significant and numerous assumptions that
will differ from company to company. Our VAR model assumes a 99 percent confidence level. Statistically, this means
that losses will exceed VAR, on average, one out of 100 trading days, or two to three times each year. Actual losses did
not exceed VAR in 2005 or 2004.
In addition to reviewing our underlying model assumptions, we seek to mitigate the uncertainties related to these
assumptions and estimates through close monitoring and by updating the assumptions and estimates on an ongoing
basis. If the results of our analysis indicate higher than expected levels of risk, proactive measures are taken to adjust
risk levels.
67