Bank of America 2005 Annual Report Download - page 69
Download and view the complete annual report
Please find page 69 of the 2005 Bank of America annual report below. You can navigate through the pages in the report by either clicking on the pages listed below, or by using the keyword search tool below to find specific information within the annual report.-
 1
1 -
2
-
3
-
4
-
5
-
6
-
7
-
8
-
9
-
10
-
11
-
12
-
13
-
14
-
15
-
16
-
17
-
18
-
19
-
20
-
21
-
22
-
23
-
24
-
25
-
26
-
27
-
28
-
29
-
30
-
31
-
32
-
33
-
34
-
35
-
36
-
37
-
38
-
39
-
40
-
41
-
42
-
43
-
44
-
45
-
46
-
47
-
48
-
49
-
50
-
51
-
52
-
53
-
54
-
55
-
56
-
57
-
58
-
 59
59 -
 60
60 -
 61
61 -
 62
62 -
 63
63 -
 64
64 -
 65
65 -
 66
66 -
 67
67 -
 68
68 -
 69
69 -
 70
70 -
 71
71 -
 72
72 -
 73
73 -
 74
74 -
 75
75 -
 76
76 -
 77
77 -
 78
78 -
 79
79 -
80
-
81
-
82
-
83
-
84
-
85
-
86
-
87
-
88
-
89
-
90
-
91
-
92
-
93
-
94
-
95
-
96
-
97
-
98
-
99
-
100
-
101
-
102
-
103
-
104
-
105
-
106
-
107
-
108
-
109
-
110
-
111
-
112
-
113
-
114
-
115
-
116
-
117
-
118
-
119
-
120
-
121
-
122
-
123
-
124
-
125
-
126
-
127
-
128
-
129
-
130
-
131
-
132
-
133
-
134
-
135
-
136
-
137
-
138
-
139
-
140
-
141
-
142
-
143
-
144
-
145
-
146
-
147
-
148
-
149
-
150
-
151
-
152
-
153
-
154
-
155
-
156
-
157
-
158
-
159
-
160
-
161
-
162
-
163
-
164
-
165
-
166
-
167
-
168
-
169
-
170
-
171
-
172
-
173
-
174
-
175
-
176
-
177
-
178
-
179
-
180
-
181
-
182
-
183
-
184
-
185
-
186
-
187
-
188
-
189
-
190
-
191
-
192
-
193
-
194
-
195
-
196
-
197
-
198
-
199
-
200
-
201
-
202
-
203
-
204
-
205
-
206
-
207
-
208
-
209
-
210
-
211
-
212
-
213
 |
 |

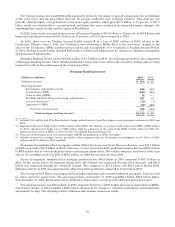
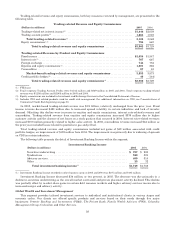
As of December 31, 2005, the MSR balance was $2.7 billion, an increase of $300 million, or 13 percent, from
December 31, 2004. This value represented 122 bps of the related unpaid principal balance, a three percent increase
from December 31, 2004. The following table outlines our MSR statistical information:
Consumer Real Estate Mortgage Servicing Rights(1)
December 31
(Dollars in millions) 2005 2004
MSR data:
Balance.................................................................. $ 2,658 $ 2,358
Capitalizationvalue ....................................................... 1.22% 1.19%
Unpaid balance(2) ............................................................. $218,172 $197,795
Number of customers (in thousands) ............................................ 1,619 1,582
(1) Excludes MSRs in Global Capital Markets and Investment Banking at December 31, 2005 and 2004 of $148 million and $123
million.
(2) Represents the portion of our servicing portfolio for which a MSR asset has been recorded.
MSRs are accounted for at the lower of cost or market with impairment recognized as a reduction to Mortgage
Banking Income. A combination of derivatives and AFS securities (e.g. mortgage-backed securities) is utilized to hedge
the changes in value associated with the MSRs. At December 31, 2005, $2.3 billion of MSRs were hedged using a SFAS
133 strategy and $250 million of MSRs were economically hedged using AFS securities. During 2005, Net Interest
Income included $18 million on these AFS securities. At December 31, 2005, the unrealized loss on AFS securities used
to economically hedge the MSRs was $29 million compared to an unrealized gain of $21 million at December 31, 2004.
For more information on MSRs, see Notes 1 and 9 of the Consolidated Financial Statements.
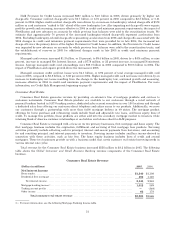
Consumer Deposit and Debit Products
Consumer Deposit and Debit Products provides a comprehensive range of products to consumers and small
businesses. Our products include traditional savings accounts, money market savings accounts, CDs and IRAs, regular
and interest-checking accounts, debit cards and a variety of business checking options.
In 2005, we added approximately 2.3 million net new retail checking accounts and 1.9 million net new retail savings
accounts. This growth resulted from continued improvement in sales and service results in the Banking Center Channel,
the introduction of new products, the addition of 99 new stores and the impact of FleetBoston. In the FleetBoston
franchise, we opened 431,000 net new retail checking and 348,000 net new retail savings accounts since the FleetBoston
Merger on April 1, 2004.
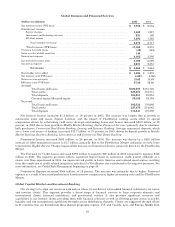
Consumer deposit products provide a relatively stable and inexpensive source of liquidity. We earn net interest
spread revenues from investing this liquidity in earning assets through client facing lending activity and our ALM
process. The revenue streams from these activities are allocated to our deposit products using our funds transfer pricing
process which takes into account the interest rates and maturity characteristics of the deposits. Deposits also generate
account fees while debit cards generate interchange income. The following table shows the components of Total Revenue
for Consumer Deposit and Debit Products.
Consumer Deposit and Debit Products Revenue
(Dollars in millions) 2005 2004
Netinterestincome............................................................... $ 8,380 $ 6,982
Deposit service charges ........................................................... 4,986 4,321
Debitcardincome ................................................................ 1,629 1,232
Total noninterest income ...................................................... 6,615 5,553
Total deposit and debit revenue ......................................... $14,995 $12,535
Total deposit and debit revenue grew $2.5 billion, or 20 percent, in 2005. Driving this growth was an increase of $1.4
billion, or 20 percent, in Net Interest Income resulting from higher levels of deposits. Also impacting the growth in Net
Interest Income was our pricing strategy and the positive impact of the FleetBoston Merger.
Deposit service charges increased $665 million, or 15 percent, in 2005. The increase was primarily due to the growth
of new accounts across our franchise and the impact of the FleetBoston Merger.
33