Bank of America 2005 Annual Report Download - page 96
Download and view the complete annual report
Please find page 96 of the 2005 Bank of America annual report below. You can navigate through the pages in the report by either clicking on the pages listed below, or by using the keyword search tool below to find specific information within the annual report.-
 1
1 -
2
-
3
-
4
-
5
-
6
-
7
-
8
-
9
-
10
-
11
-
12
-
13
-
14
-
15
-
16
-
17
-
18
-
19
-
20
-
21
-
22
-
23
-
24
-
25
-
26
-
27
-
28
-
29
-
30
-
31
-
32
-
33
-
34
-
35
-
36
-
37
-
38
-
39
-
40
-
41
-
42
-
43
-
44
-
45
-
46
-
47
-
48
-
49
-
50
-
51
-
52
-
53
-
54
-
55
-
56
-
57
-
58
-
59
-
60
-
61
-
62
-
63
-
64
-
65
-
66
-
67
-
68
-
69
-
70
-
71
-
72
-
73
-
74
-
75
-
76
-
77
-
78
-
79
-
80
-
81
-
82
-
83
-
84
-
85
-
 86
86 -
 87
87 -
 88
88 -
 89
89 -
 90
90 -
 91
91 -
 92
92 -
 93
93 -
 94
94 -
 95
95 -
 96
96 -
 97
97 -
 98
98 -
 99
99 -
 100
100 -
 101
101 -
 102
102 -
 103
103 -
 104
104 -
 105
105 -
 106
106 -
107
-
108
-
109
-
110
-
111
-
112
-
113
-
114
-
115
-
116
-
117
-
118
-
119
-
120
-
121
-
122
-
123
-
124
-
125
-
126
-
127
-
128
-
129
-
130
-
131
-
132
-
133
-
134
-
135
-
136
-
137
-
138
-
139
-
140
-
141
-
142
-
143
-
144
-
145
-
146
-
147
-
148
-
149
-
150
-
151
-
152
-
153
-
154
-
155
-
156
-
157
-
158
-
159
-
160
-
161
-
162
-
163
-
164
-
165
-
166
-
167
-
168
-
169
-
170
-
171
-
172
-
173
-
174
-
175
-
176
-
177
-
178
-
179
-
180
-
181
-
182
-
183
-
184
-
185
-
186
-
187
-
188
-
189
-
190
-
191
-
192
-
193
-
194
-
195
-
196
-
197
-
198
-
199
-
200
-
201
-
202
-
203
-
204
-
205
-
206
-
207
-
208
-
209
-
210
-
211
-
212
-
213
 |
 |

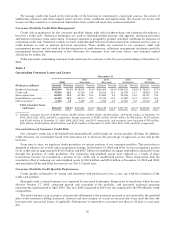
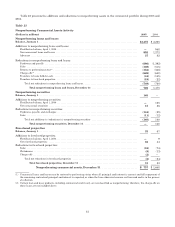
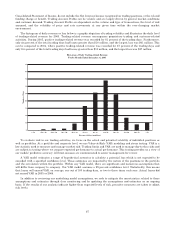
Nonperforming commercial—domestic loans and leases decreased by $274 million and represented 0.41 percent of
commercial—domestic loans and leases at December 31, 2005 compared to 0.70 percent at December 31, 2004. The
improvement in the percentage of nonperforming commercial—domestic to total commercial—domestic was driven by a
broad-based decrease in nonperforming loans and leases across several industries, the largest of which were utilities,
and metals and mining. Nonperforming commercial lease financing decreased $204 million primarily due to the
previously mentioned charge-offs associated with the domestic airline industry, and represented 0.30 percent of
commercial lease financing at December 31, 2005 compared to 1.26 percent at December 31, 2004. Nonperforming
commercial—foreign decreased $233 million and represented 0.16 percent of commercial—foreign at December 31, 2005
compared to 1.45 percent at December 31, 2004. The improvement in the percentage of nonperforming commercial—
foreign to total commercial—foreign was attributable to Latin America.
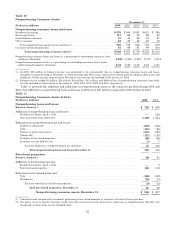
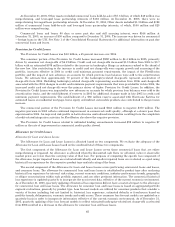
The $140 million decrease in nonperforming securities from December 31, 2004 was primarily driven by an
exchange of nonperforming securities for performing securities in Argentina that resulted from the completion of a
government mandated securities exchange program.
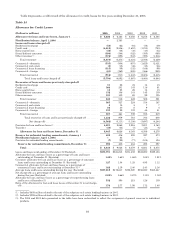
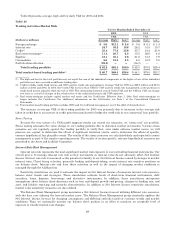
Table 22 presents nonperforming commercial assets for each year in the five-year period ending December 31, 2005.
Table 22
Nonperforming Commercial Assets
December 31
(Dollars in millions) 2005 2004 2003 2002 2001
Nonperforming commercial loans and leases
Commercial—domestic ........................................................ $ 581 $ 855 $1,388 $2,621 $2,991
Commercial real estate ....................................................... 49 87 142 164 243
Commercial lease financing .................................................... 62 266 127 160 134
Commercial—foreign ......................................................... 34 267 578 1,359 459
Total nonperforming commercial loans and leases(1) ........................... 726 1,475 2,235 4,304 3,827
Nonperforming securities(2) .................................................... —140 — — —
Commercial foreclosed properties ............................................... 31 33 67 126 68
Total nonperforming commercial assets(3) ........................... $ 757 $1,648 $2,302 $4,430 $3,895
Nonperforming commercial loans and leases as a percentage of outstanding
commercial loans and leases ................................................. 0.33% 0.76% 1.70% 2.96% 2.33%
Nonperforming commercial assets as a percentage of outstanding commercial loans,
leases and foreclosed properties .............................................. 0.35 0.85 1.75 3.05 2.38
(1) In 2005, $51 million in Interest Income was estimated to be contractually due on nonperforming commercial loans and leases
classified as nonperforming at December 31, 2005, including troubled debt restructured loans of which $31 million were performing
at December 31, 2005 and not included in the table above. Approximately $15 million of the estimated $51 million in contractual
interest was received and included in net income for 2005.
(2) Primarily related to international securities held in the AFS portfolio.
(3) Balances do not include $45 million, $123 million, $186 million, $73 million, and $289 million of nonperforming commercial assets,
primarily commercial loans held-for-sale, included in Other Assets at December 31, 2005, 2004, 2003, 2002, and 2001, respectively.
60