Bank of America 2005 Annual Report Download - page 63
Download and view the complete annual report
Please find page 63 of the 2005 Bank of America annual report below. You can navigate through the pages in the report by either clicking on the pages listed below, or by using the keyword search tool below to find specific information within the annual report.-
 1
1 -
2
-
3
-
4
-
5
-
6
-
7
-
8
-
9
-
10
-
11
-
12
-
13
-
14
-
15
-
16
-
17
-
18
-
19
-
20
-
21
-
22
-
23
-
24
-
25
-
26
-
27
-
28
-
29
-
30
-
31
-
32
-
33
-
34
-
35
-
36
-
37
-
38
-
39
-
40
-
41
-
42
-
43
-
44
-
45
-
46
-
47
-
48
-
49
-
50
-
51
-
52
-
 53
53 -
 54
54 -
 55
55 -
 56
56 -
 57
57 -
 58
58 -
 59
59 -
 60
60 -
 61
61 -
 62
62 -
 63
63 -
 64
64 -
 65
65 -
 66
66 -
 67
67 -
 68
68 -
 69
69 -
 70
70 -
 71
71 -
 72
72 -
 73
73 -
74
-
75
-
76
-
77
-
78
-
79
-
80
-
81
-
82
-
83
-
84
-
85
-
86
-
87
-
88
-
89
-
90
-
91
-
92
-
93
-
94
-
95
-
96
-
97
-
98
-
99
-
100
-
101
-
102
-
103
-
104
-
105
-
106
-
107
-
108
-
109
-
110
-
111
-
112
-
113
-
114
-
115
-
116
-
117
-
118
-
119
-
120
-
121
-
122
-
123
-
124
-
125
-
126
-
127
-
128
-
129
-
130
-
131
-
132
-
133
-
134
-
135
-
136
-
137
-
138
-
139
-
140
-
141
-
142
-
143
-
144
-
145
-
146
-
147
-
148
-
149
-
150
-
151
-
152
-
153
-
154
-
155
-
156
-
157
-
158
-
159
-
160
-
161
-
162
-
163
-
164
-
165
-
166
-
167
-
168
-
169
-
170
-
171
-
172
-
173
-
174
-
175
-
176
-
177
-
178
-
179
-
180
-
181
-
182
-
183
-
184
-
185
-
186
-
187
-
188
-
189
-
190
-
191
-
192
-
193
-
194
-
195
-
196
-
197
-
198
-
199
-
200
-
201
-
202
-
203
-
204
-
205
-
206
-
207
-
208
-
209
-
210
-
211
-
212
-
213
 |
 |
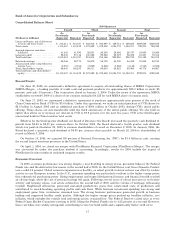
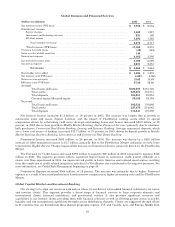
segment is called Global Corporate and Investment Banking. This new segment will enable us to more effectively
leverage the universal bank model in servicing our business clients. In the universal bank model, teams of consumer,
commercial and investment bankers work together to provide all clients, regardless of size, the right combination of
products and services to meet their needs. All Other consists primarily of Equity Investments, the residual impact of the
allowance for credit losses process, Merger and Restructuring Charges, intersegment eliminations, and the results of
certain consumer finance and commercial lending businesses that are being liquidated. All Other also includes certain
amounts associated with the ALM process, including the impact of funds transfer pricing allocation methodologies,
amounts associated with the change in the value of derivatives used as economic hedges of interest rate and foreign
exchange rate fluctuations that do not qualify for SFAS 133 hedge accounting treatment, gains or losses on sales of
whole mortgage loans, and Gains on Sales of Debt Securities. For more information on All Other, see page 40.
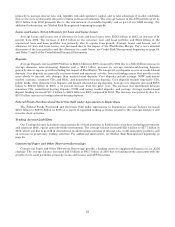
Basis of Presentation
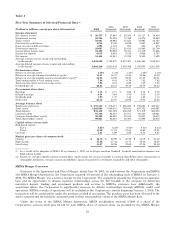
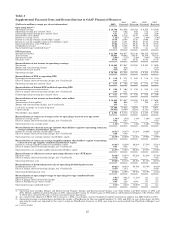
We prepare and evaluate segment results using certain non-GAAP methodologies and performance measures many
of which are discussed in Supplemental Financial Data on page 24. We begin by evaluating the operating results of the
businesses, which by definition excludes Merger and Restructuring Charges. The segment results also reflect certain
revenue and expense methodologies, which are utilized to determine operating income. The Net Interest Income of the
business segments includes the results of a funds transfer pricing process that matches assets and liabilities with
similar interest rate sensitivity and maturity characteristics. Net Interest Income also reflects an allocation of Net
Interest Income generated by assets and liabilities used in our ALM process. The results of the business segments will
fluctuate based on the performance of corporate ALM activities. The restatement impact to Net Interest Income,
associated with the economic hedges that did not qualify for SFAS 133 hedge accounting, was included in All Other, and
was not allocated to the business segments.
Certain expenses not directly attributable to a specific business segment are allocated to the segments based on
pre-determined means. The most significant of these expenses include data processing costs, item processing costs and
certain centralized or shared functions. Data processing costs are allocated to the segments based on equipment usage.
Item processing costs are allocated to the segments based on the volume of items processed for each segment. The costs
of certain centralized or shared functions are allocated based on methodologies which reflect utilization.
Equity is allocated to the business segments using a risk-adjusted methodology incorporating each unit’s credit,
market and operational risk components. The nature of these risks is discussed further beginning on page 49. ROE is
calculated by dividing Net Income by allocated equity. SVA is defined as cash basis earnings on an operating basis less a
charge for the use of capital (i.e. equity). Cash basis earnings on an operating basis is defined as Net Income adjusted to
exclude Merger and Restructuring Charges, and Amortization of Intangibles. The charge for capital is calculated by
multiplying 11 percent (management’s estimate of the shareholders’ minimum required rate of return on capital
invested) by average total common shareholders’ equity at the corporate level and by average allocated equity at the
business segment level. Average equity is allocated to the business level using a methodology identical to that used in
the ROE calculation. Management reviews the estimate of the rate used to calculate the capital charge annually. The
Capital Asset Pricing Model is used to estimate our cost of capital.
See Note 20 of the Consolidated Financial Statements for additional business segment information, selected
financial information for the business segments and reconciliations to consolidated Total Revenue and Net Income
amounts.
27