Bank of America 2005 Annual Report Download - page 76
Download and view the complete annual report
Please find page 76 of the 2005 Bank of America annual report below. You can navigate through the pages in the report by either clicking on the pages listed below, or by using the keyword search tool below to find specific information within the annual report.-
 1
1 -
2
-
3
-
4
-
5
-
6
-
7
-
8
-
9
-
10
-
11
-
12
-
13
-
14
-
15
-
16
-
17
-
18
-
19
-
20
-
21
-
22
-
23
-
24
-
25
-
26
-
27
-
28
-
29
-
30
-
31
-
32
-
33
-
34
-
35
-
36
-
37
-
38
-
39
-
40
-
41
-
42
-
43
-
44
-
45
-
46
-
47
-
48
-
49
-
50
-
51
-
52
-
53
-
54
-
55
-
56
-
57
-
58
-
59
-
60
-
61
-
62
-
63
-
64
-
65
-
 66
66 -
 67
67 -
 68
68 -
 69
69 -
 70
70 -
 71
71 -
 72
72 -
 73
73 -
 74
74 -
 75
75 -
 76
76 -
 77
77 -
 78
78 -
 79
79 -
 80
80 -
 81
81 -
 82
82 -
 83
83 -
 84
84 -
 85
85 -
 86
86 -
87
-
88
-
89
-
90
-
91
-
92
-
93
-
94
-
95
-
96
-
97
-
98
-
99
-
100
-
101
-
102
-
103
-
104
-
105
-
106
-
107
-
108
-
109
-
110
-
111
-
112
-
113
-
114
-
115
-
116
-
117
-
118
-
119
-
120
-
121
-
122
-
123
-
124
-
125
-
126
-
127
-
128
-
129
-
130
-
131
-
132
-
133
-
134
-
135
-
136
-
137
-
138
-
139
-
140
-
141
-
142
-
143
-
144
-
145
-
146
-
147
-
148
-
149
-
150
-
151
-
152
-
153
-
154
-
155
-
156
-
157
-
158
-
159
-
160
-
161
-
162
-
163
-
164
-
165
-
166
-
167
-
168
-
169
-
170
-
171
-
172
-
173
-
174
-
175
-
176
-
177
-
178
-
179
-
180
-
181
-
182
-
183
-
184
-
185
-
186
-
187
-
188
-
189
-
190
-
191
-
192
-
193
-
194
-
195
-
196
-
197
-
198
-
199
-
200
-
201
-
202
-
203
-
204
-
205
-
206
-
207
-
208
-
209
-
210
-
211
-
212
-
213
 |
 |

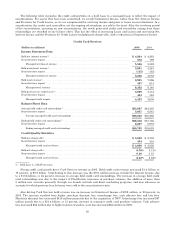
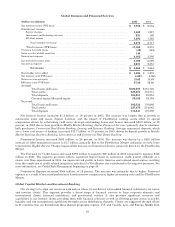
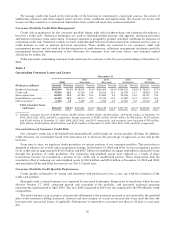
Noninterest Income increased $559 million, or 18 percent, in 2005. Noninterest Income consists primarily of
Investment and Brokerage Services, which represents fees earned on client assets and brokerage commissions. The
Investment and Brokerage Services revenue increase in 2005, compared to 2004, was mainly due to the impact of
FleetBoston.
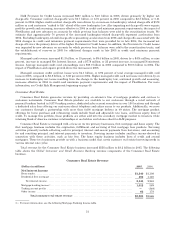
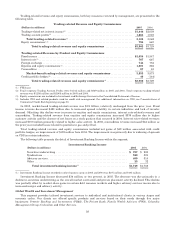
Client Assets
December 31
(Dollars in billions) 2005 2004
Assets under management ................................................. $482.4 $451.5
Client brokerage assets .................................................... 161.7 149.9
Assets in custody .......................................................... 94.2 107.0
Total client assets ................................................... $738.3 $708.4
Total client assets increased $29.9 billion, or four percent, in 2005. This increase was due to the $30.9 billion
increase in assets under management in 2005, which was driven by net inflows primarily in short-term money market
assets and an increase in overall market valuations. Assets under management generate fees based on a percentage of
their market value. They consist largely of mutual funds and separate accounts, which are comprised of taxable and
nontaxable money market products, equities, and taxable and nontaxable fixed income securities.
Noninterest Expense increased $241 million, or seven percent, in 2005. The increase was due primarily to increased
Personnel expenses driven by PB&I growth in the Northeast and the impact of FleetBoston. This increase was partially
offset by lower other general operating expenses due to the segment’s share of the mutual fund settlement recorded in
2004.
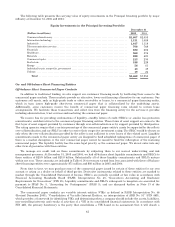
All Other
Included in All Other are our Equity Investments businesses, and Other.
Equity Investments include Principal Investing and corporate investments. Principal Investing is comprised of a
diversified portfolio of investments in privately-held and publicly-traded companies at all stages of their life cycle from
start-up to buyout. Corporate investments include CCB, Grupo Financiero Santander Serfin and various other
investments.
Other includes the residual impact of the allowance for credit losses process, Merger and Restructuring Charges,
intersegment eliminations, and the results of certain consumer finance and commercial lending businesses that are
being liquidated. Other also includes certain amounts associated with the ALM process, including the impact of funds
transfer pricing allocation methodologies, amounts associated with the change in the value of derivatives used as
economic hedges of interest rate and foreign exchange rate fluctuations that do not qualify for SFAS 133 hedge
accounting treatment, gains or losses on sales of whole mortgage loans, and Gains on Sales of Debt Securities. The
objective of the funds transfer pricing allocation methodology is to neutralize the business segments from changes in
interest rate and foreign exchange fluctuations. Accordingly, for segment reporting purposes, the business segments
receive the neutralizing benefit to Net Interest Income related to the economic hedges previously mentioned, with the
offset recorded in Other.
40