Bank of America 2005 Annual Report Download - page 128
Download and view the complete annual report
Please find page 128 of the 2005 Bank of America annual report below. You can navigate through the pages in the report by either clicking on the pages listed below, or by using the keyword search tool below to find specific information within the annual report.-
 1
1 -
2
-
3
-
4
-
5
-
6
-
7
-
8
-
9
-
10
-
11
-
12
-
13
-
14
-
15
-
16
-
17
-
18
-
19
-
20
-
21
-
22
-
23
-
24
-
25
-
26
-
27
-
28
-
29
-
30
-
31
-
32
-
33
-
34
-
35
-
36
-
37
-
38
-
39
-
40
-
41
-
42
-
43
-
44
-
45
-
46
-
47
-
48
-
49
-
50
-
51
-
52
-
53
-
54
-
55
-
56
-
57
-
58
-
59
-
60
-
61
-
62
-
63
-
64
-
65
-
66
-
67
-
68
-
69
-
70
-
71
-
72
-
73
-
74
-
75
-
76
-
77
-
78
-
79
-
80
-
81
-
82
-
83
-
84
-
85
-
86
-
87
-
88
-
89
-
90
-
91
-
92
-
93
-
94
-
95
-
96
-
97
-
98
-
99
-
100
-
101
-
102
-
103
-
104
-
105
-
106
-
107
-
108
-
109
-
110
-
111
-
112
-
113
-
114
-
115
-
116
-
117
-
 118
118 -
 119
119 -
 120
120 -
 121
121 -
 122
122 -
 123
123 -
 124
124 -
 125
125 -
 126
126 -
 127
127 -
 128
128 -
 129
129 -
 130
130 -
 131
131 -
 132
132 -
 133
133 -
 134
134 -
 135
135 -
 136
136 -
 137
137 -
 138
138 -
139
-
140
-
141
-
142
-
143
-
144
-
145
-
146
-
147
-
148
-
149
-
150
-
151
-
152
-
153
-
154
-
155
-
156
-
157
-
158
-
159
-
160
-
161
-
162
-
163
-
164
-
165
-
166
-
167
-
168
-
169
-
170
-
171
-
172
-
173
-
174
-
175
-
176
-
177
-
178
-
179
-
180
-
181
-
182
-
183
-
184
-
185
-
186
-
187
-
188
-
189
-
190
-
191
-
192
-
193
-
194
-
195
-
196
-
197
-
198
-
199
-
200
-
201
-
202
-
203
-
204
-
205
-
206
-
207
-
208
-
209
-
210
-
211
-
212
-
213
 |
 |

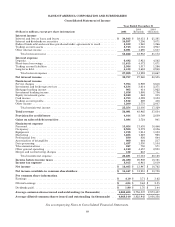
BANK OF AMERICA CORPORATION AND SUBSIDIARIES
Consolidated Statement of Cash Flows
Year Ended December 31
(Dollars in millions) 2005 2004
(Restated) 2003
(Restated)
Operating activities
Netincome ........................................................................... $ 16,465 $ 13,947 $ 10,762
Reconciliation of net income to net cash provided by (used in) operating activities:
Provision for credit losses ........................................................... 4,014 2,769 2,839
Gains on sales of debt securities ..................................................... (1,084) (1,724) (941)
Depreciation and premises improvements amortization ................................. 959 972 890
Amortization of intangibles ......................................................... 809 664 217
Deferred income tax expense (benefit) ................................................ 1,695 (519) (295)
Net increase in trading and derivative instruments ..................................... (18,911) (13,944) (13,639)
Net (increase) decrease in other assets ................................................ (104) (11,928) 10,647
Net increase (decrease) in accrued expenses and other liabilities ......................... (8,205) 4,594 12,067
Other operating activities, net ....................................................... (7,861) 1,647 439
Net cash provided by (used in) operating activities .................................. (12,223) (3,522) 22,986
Investing activities
Net increase in time deposits placed and other short-term investments ....................... (439) (1,147) (1,238)
Net increase in federal funds sold and securities purchased under agreements to resell ......... (58,425) (3,880) (31,614)
Proceeds from sales of available-for-sale securities ......................................... 134,490 117,672 171,711
Proceeds from maturities of available-for-sale securities .................................... 39,519 26,973 26,953
Purchases of available-for-sale securities ................................................. (204,476) (243,573) (195,852)
Proceeds from maturities of held-to-maturity securities ..................................... 283 153 779
Proceeds from sales of loans and leases ................................................... 14,458 4,416 32,672
Other changes in loans and leases, net ................................................... (71,078) (32,350) (74,037)
Additions to mortgage servicing rights, net ................................................ (736) (1,075) (1,690)
Net purchases of premises and equipment ................................................ (1,228) (863) (209)
Proceeds from sales of foreclosed properties ............................................... 132 198 247
Investment in China Construction Bank .................................................. (3,000) ——
Investment in Grupo Financiero Santander Serfin ......................................... —— (1,600)
Net cash (paid for) acquired in business acquisitions ....................................... (49) 4,936 (141)
Other investing activities, net ........................................................... 104 986 898
Net cash used in investing activities .............................................. (150,445) (127,554) (73,121)
Financing activities
Net increase in deposits ................................................................ 16,100 64,423 27,655
Net increase in federal funds purchased and securities sold under agreements to repurchase .... 120,914 35,752 12,967
Net increase in commercial paper and other short-term borrowings .......................... 37,671 37,437 13,917
Proceeds from issuance of long-term debt ................................................. 21,958 21,289 16,963
Retirement of long-term debt ............................................................ (15,107) (16,904) (9,282)
Proceeds from issuance of common stock .................................................. 2,846 3,712 3,970
Common stock repurchased ............................................................. (5,765) (6,286) (9,766)
Cash dividends paid ................................................................... (7,683) (6,468) (4,281)
Other financing activities, net ........................................................... (117) (91) (72)
Net cash provided by financing activities .......................................... 170,817 132,864 52,071
Effect of exchange rate changes on cash and cash equivalents ............................... (86) 64 175
Net increase in cash and cash equivalents ................................................ 8,063 1,852 2,111
Cash and cash equivalents at January 1 .................................................. 28,936 27,084 24,973
Cash and cash equivalents at December 31 ................................ $ 36,999 $ 28,936 $ 27,084
Supplemental cash flow disclosures
Cashpaidforinterest .................................................................. $ 26,239 $ 13,765 $ 10,214
Cash paid for income taxes .............................................................. 7,049 6,088 3,870
Assets and liabilities of a certain multi-seller asset-backed commercial paper conduit that was consolidated amounted to $4,350 million
in 2003.
Net transfers of Loans and Leases to loans held-for-sale (included in Other Assets) from the loan portfolio for Asset and Liability
Management purposes amounted to $73 million in 2005.
Net transfers of Loans and Leases from loans held-for-sale to the loan portfolio for Asset and Liability Management purposes amounted
to $1,106 million and $9,683 million in 2004 and 2003.
In 2004, the fair values of noncash assets acquired and liabilities assumed in the merger with FleetBoston were $224,492 million and
$182,862 million.
In 2004, approximately 1.2 billion shares of common stock, valued at approximately $45,622 million, were issued in connection with the
merger with FleetBoston.
See accompanying Notes to Consolidated Financial Statements.
92