Bank of America 2005 Annual Report Download - page 90
Download and view the complete annual report
Please find page 90 of the 2005 Bank of America annual report below. You can navigate through the pages in the report by either clicking on the pages listed below, or by using the keyword search tool below to find specific information within the annual report.-
 1
1 -
2
-
3
-
4
-
5
-
6
-
7
-
8
-
9
-
10
-
11
-
12
-
13
-
14
-
15
-
16
-
17
-
18
-
19
-
20
-
21
-
22
-
23
-
24
-
25
-
26
-
27
-
28
-
29
-
30
-
31
-
32
-
33
-
34
-
35
-
36
-
37
-
38
-
39
-
40
-
41
-
42
-
43
-
44
-
45
-
46
-
47
-
48
-
49
-
50
-
51
-
52
-
53
-
54
-
55
-
56
-
57
-
58
-
59
-
60
-
61
-
62
-
63
-
64
-
65
-
66
-
67
-
68
-
69
-
70
-
71
-
72
-
73
-
74
-
75
-
76
-
77
-
78
-
79
-
 80
80 -
 81
81 -
 82
82 -
 83
83 -
 84
84 -
 85
85 -
 86
86 -
 87
87 -
 88
88 -
 89
89 -
 90
90 -
 91
91 -
 92
92 -
 93
93 -
 94
94 -
 95
95 -
 96
96 -
 97
97 -
 98
98 -
 99
99 -
 100
100 -
101
-
102
-
103
-
104
-
105
-
106
-
107
-
108
-
109
-
110
-
111
-
112
-
113
-
114
-
115
-
116
-
117
-
118
-
119
-
120
-
121
-
122
-
123
-
124
-
125
-
126
-
127
-
128
-
129
-
130
-
131
-
132
-
133
-
134
-
135
-
136
-
137
-
138
-
139
-
140
-
141
-
142
-
143
-
144
-
145
-
146
-
147
-
148
-
149
-
150
-
151
-
152
-
153
-
154
-
155
-
156
-
157
-
158
-
159
-
160
-
161
-
162
-
163
-
164
-
165
-
166
-
167
-
168
-
169
-
170
-
171
-
172
-
173
-
174
-
175
-
176
-
177
-
178
-
179
-
180
-
181
-
182
-
183
-
184
-
185
-
186
-
187
-
188
-
189
-
190
-
191
-
192
-
193
-
194
-
195
-
196
-
197
-
198
-
199
-
200
-
201
-
202
-
203
-
204
-
205
-
206
-
207
-
208
-
209
-
210
-
211
-
212
-
213
 |
 |

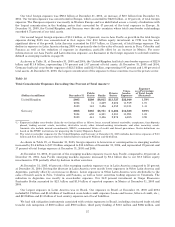
At December 31, 2005 and 2004, we had a net notional amount of credit default protection purchased in our credit
derivatives portfolio of $14.7 billion and $10.8 billion. Our credit portfolio hedges, including the impact of
mark-to-market, resulted in net gains of $49 million in 2005 and net losses of $144 million in 2004. Gains for 2005
primarily reflected the impact of spread widening in certain industries in the first half of the year.
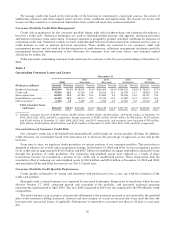
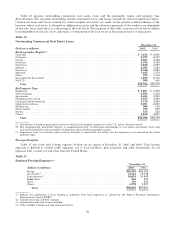
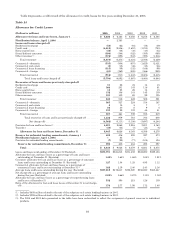
Table 13 shows commercial utilized credit exposure by industry based on Standard & Poor’s industry classifications
and includes commercial loans and leases, SBLCs and financial guarantees, derivative assets, assets held-for-sale, and
commercial letters of credit. These amounts exclude the impact of our credit hedging activities, which are separately
included in the table. To lessen the cost of obtaining our desired credit protection levels, credit exposure may be added
within an industry, borrower or counterparty group by selling protection. A negative notional amount indicates a net
amount of protection purchased in a particular industry; conversely, a positive notional amount indicates a net amount
of protection sold in a particular industry. Credit protection is purchased to cover the funded portion as well as the
unfunded portion of credit exposure. As shown in the table below, commercial utilized credit exposure is diversified
across a range of industries.
Table 13
Commercial Utilized Credit Exposure and Net Credit Default Protection by Industry
Commercial Utilized Credit Exposure(1) Net Credit Default Protection(2)
December 31 December 31
(Dollars in millions) 2005 2004 2005 2004
Real estate(3) ................................. $ 41,665 $ 36,672 $ (788) $ (268)
Banks ....................................... 26,514 25,265 31 61
Diversified financials .......................... 25,859 25,932 (543) (1,177)
Retailing ..................................... 23,913 23,149 (1,124) (829)
Education and government ..................... 22,331 17,429 ——
Individuals and trusts ......................... 17,237 16,110 (30) —
Materials .................................... 16,477 14,123 (1,149) (469)
Consumer durables and apparel ................. 14,988 13,427 (772) (406)
Capital goods ................................. 13,640 12,633 (751) (819)
Commercial services and supplies ............... 13,605 11,944 (472) (175)
Transportation ............................... 13,449 13,234 (392) (143)
Healthcare equipment and services .............. 13,294 12,196 (709) (354)
Leisureandsports,hotelsandrestaurants ....... 13,005 13,331 (874) (357)
Food, beverage and tobacco ..................... 11,578 11,687 (621) (226)
Energy ...................................... 9,992 7,579 (559) (457)
Media ....................................... 6,608 6,232 (1,790) (801)
Religious and social organizations ............... 6,340 5,710 ——
Utilities ...................................... 4,858 5,615 (899) (402)
Insurance .................................... 4,692 5,851 (1,453) (643)
Food and staples retailing ...................... 3,802 3,610 (334) (258)
Technology hardware and equipment ............ 3,737 3,398 (563) (301)
Telecommunicationservices .................... 3,461 3,030 (1,205) (808)
Softwareandservices.......................... 2,668 3,292 (299) (131)
Automobiles and components ................... 1,681 1,894 (679) (1,431)
Pharmaceuticals and biotechnology .............. 1,647 1,441 (470) (202)
Household and personal products ............... 379 371 75 8
Other........................................ 2,587 3,132 1,677(4) (260)(4)
Total .................................... $320,007 $298,287 $(14,693) $(10,848)
(1) Derivative assets are reported on a mark-to-market basis and have not been reduced by the amount of collateral applied. Derivative
asset collateral totaled $17.1 billion and $17.7 billion at December 31, 2005 and 2004.
(2) Represents notional amounts at December 31, 2005 and 2004.
(3) Industries are viewed from a variety of perspectives to best isolate the perceived risks. For purposes of this table, the real estate
industry is defined based upon the borrowers’ or counterparties’ primary business activity using operating cash flow and primary
source of repayment as key factors.
(4) Represents net CDS index positions, which were principally investment grade. Indices are comprised of corporate credit derivatives
that trade as an aggregate index value. Generally, they are grouped into portfolios based on specific ratings of credit quality or
global geographic location. As of December 31, 2005, CDS index positions were sold to reflect a short-term positive view of the credit
markets.
54