Bank of America 2005 Annual Report Download - page 146
Download and view the complete annual report
Please find page 146 of the 2005 Bank of America annual report below. You can navigate through the pages in the report by either clicking on the pages listed below, or by using the keyword search tool below to find specific information within the annual report.-
 1
1 -
2
-
3
-
4
-
5
-
6
-
7
-
8
-
9
-
10
-
11
-
12
-
13
-
14
-
15
-
16
-
17
-
18
-
19
-
20
-
21
-
22
-
23
-
24
-
25
-
26
-
27
-
28
-
29
-
30
-
31
-
32
-
33
-
34
-
35
-
36
-
37
-
38
-
39
-
40
-
41
-
42
-
43
-
44
-
45
-
46
-
47
-
48
-
49
-
50
-
51
-
52
-
53
-
54
-
55
-
56
-
57
-
58
-
59
-
60
-
61
-
62
-
63
-
64
-
65
-
66
-
67
-
68
-
69
-
70
-
71
-
72
-
73
-
74
-
75
-
76
-
77
-
78
-
79
-
80
-
81
-
82
-
83
-
84
-
85
-
86
-
87
-
88
-
89
-
90
-
91
-
92
-
93
-
94
-
95
-
96
-
97
-
98
-
99
-
100
-
101
-
102
-
103
-
104
-
105
-
106
-
107
-
108
-
109
-
110
-
111
-
112
-
113
-
114
-
115
-
116
-
117
-
118
-
119
-
120
-
121
-
122
-
123
-
124
-
125
-
126
-
127
-
128
-
129
-
130
-
131
-
132
-
133
-
134
-
135
-
 136
136 -
 137
137 -
 138
138 -
 139
139 -
 140
140 -
 141
141 -
 142
142 -
 143
143 -
 144
144 -
 145
145 -
 146
146 -
 147
147 -
 148
148 -
 149
149 -
 150
150 -
 151
151 -
 152
152 -
 153
153 -
 154
154 -
 155
155 -
 156
156 -
157
-
158
-
159
-
160
-
161
-
162
-
163
-
164
-
165
-
166
-
167
-
168
-
169
-
170
-
171
-
172
-
173
-
174
-
175
-
176
-
177
-
178
-
179
-
180
-
181
-
182
-
183
-
184
-
185
-
186
-
187
-
188
-
189
-
190
-
191
-
192
-
193
-
194
-
195
-
196
-
197
-
198
-
199
-
200
-
201
-
202
-
203
-
204
-
205
-
206
-
207
-
208
-
209
-
210
-
211
-
212
-
213
 |
 |

BANK OF AMERICA CORPORATION AND SUBSIDIARIES
Notes to Consolidated Financial Statements—(Continued)
A portion of the derivative activity involves exchange-traded instruments. Exchange-traded instruments conform to
standard terms and are subject to policies set by the exchange involved, including margin and security deposit
requirements. Management believes the credit risk associated with these types of instruments is minimal. The average
fair value of Derivative Assets for 2005 and 2004 was $25.9 billion and $28.0 billion. The average fair value of Derivative
Liabilities for 2005 and 2004 was $16.8 billion and $15.7 billion.
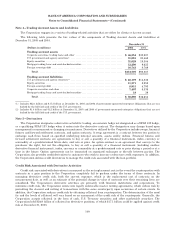
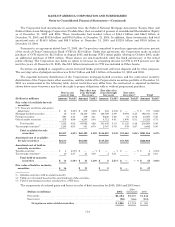
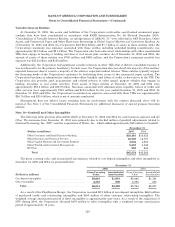
The following table presents the contract/notional amounts and credit risk amounts at December 31, 2005 and 2004
of all the Corporation’s derivative positions. These derivative positions are primarily executed in the over-the-counter
market. The credit risk amounts take into consideration the effects of legally enforceable master netting agreements,
and on an aggregate basis have been reduced by the cash collateral applied against Derivative Assets. At December 31,
2005 and 2004, the cash collateral applied against Derivative Assets on the Consolidated Balance Sheet was $9.3 billion
and $9.4 billion. In addition, at December 31, 2005 and 2004, the cash collateral placed against Derivative Liabilities
was $7.6 billion and $6.0 billion.
Derivatives(1)
December 31
2005 2004
(Dollars in millions) Contract/
Notional Credit
Risk Contract/
Notional Credit
Risk
Interest rate contracts
Swaps ................................................................ $14,401,577 $11,085 $11,597,813 $12,705
Futuresandforwards ................................................... 2,113,717 — 1,833,216 332
Written options ........................................................ 900,036 — 988,253 —
Purchased options ...................................................... 869,471 3,345 1,243,809 4,840
Foreign exchange contracts
Swaps ................................................................ 333,487 3,735 305,999 7,859
Spot, futures and forwards ............................................... 944,321 2,481 956,995 3,593
Written options ........................................................ 214,668 — 167,225 —
Purchased options ...................................................... 229,049 1,214 163,243 679
Equity contracts
Swaps ................................................................ 28,287 548 34,130 1,039
Futuresandforwards ................................................... 6,479 44 4,078 —
Written options ........................................................ 69,048 — 37,080 —
Purchased options ...................................................... 57,693 6,729 32,893 5,741
Commodity contracts
Swaps ................................................................ 8,809 2,475 10,480 2,099
Futuresandforwards ................................................... 5,533 — 6,307 6
Written options ........................................................ 7,854 — 9,270 —
Purchased options ...................................................... 3,673 546 5,535 301
Credit derivatives(2) .......................................... 2,017,896 766 499,741 430
Creditriskbeforecashcollateral ......................................... 32,968 39,624
Less: Cash collateral applied ............................................. 9,256 9,389
Total derivative assets ............................................ $23,712 $30,235
(1) Includes long and short derivative positions.
(2) The increase in credit derivatives notional amounts reflects structured basket transactions and customer-driven activity.
ALM Process
Interest rate contracts and foreign exchange contracts are utilized in the Corporation’s ALM process. The
Corporation maintains an overall interest rate risk management strategy that incorporates the use of interest rate
contracts to minimize significant fluctuations in earnings that are caused by interest rate volatility. The Corporation’s
goal is to manage interest rate sensitivity so that movements in interest rates do not significantly adversely affect Net
Interest Income. As a result of interest rate fluctuations, hedged fixed-rate assets and liabilities appreciate or depreciate
in market value. Gains or losses on the derivative instruments that are linked to the hedged fixed-rate assets and
liabilities are expected to substantially offset this unrealized appreciation or depreciation. Interest Income and Interest
Expense on hedged variable-rate assets and liabilities increase or decrease as a result of interest rate fluctuations. Gains
and losses on the derivative instruments that are linked to these hedged assets and liabilities are expected to
substantially offset this variability in earnings.
110