Bank of America 2005 Annual Report Download - page 64
Download and view the complete annual report
Please find page 64 of the 2005 Bank of America annual report below. You can navigate through the pages in the report by either clicking on the pages listed below, or by using the keyword search tool below to find specific information within the annual report.-
 1
1 -
2
-
3
-
4
-
5
-
6
-
7
-
8
-
9
-
10
-
11
-
12
-
13
-
14
-
15
-
16
-
17
-
18
-
19
-
20
-
21
-
22
-
23
-
24
-
25
-
26
-
27
-
28
-
29
-
30
-
31
-
32
-
33
-
34
-
35
-
36
-
37
-
38
-
39
-
40
-
41
-
42
-
43
-
44
-
45
-
46
-
47
-
48
-
49
-
50
-
51
-
52
-
53
-
 54
54 -
 55
55 -
 56
56 -
 57
57 -
 58
58 -
 59
59 -
 60
60 -
 61
61 -
 62
62 -
 63
63 -
 64
64 -
 65
65 -
 66
66 -
 67
67 -
 68
68 -
 69
69 -
 70
70 -
 71
71 -
 72
72 -
 73
73 -
 74
74 -
75
-
76
-
77
-
78
-
79
-
80
-
81
-
82
-
83
-
84
-
85
-
86
-
87
-
88
-
89
-
90
-
91
-
92
-
93
-
94
-
95
-
96
-
97
-
98
-
99
-
100
-
101
-
102
-
103
-
104
-
105
-
106
-
107
-
108
-
109
-
110
-
111
-
112
-
113
-
114
-
115
-
116
-
117
-
118
-
119
-
120
-
121
-
122
-
123
-
124
-
125
-
126
-
127
-
128
-
129
-
130
-
131
-
132
-
133
-
134
-
135
-
136
-
137
-
138
-
139
-
140
-
141
-
142
-
143
-
144
-
145
-
146
-
147
-
148
-
149
-
150
-
151
-
152
-
153
-
154
-
155
-
156
-
157
-
158
-
159
-
160
-
161
-
162
-
163
-
164
-
165
-
166
-
167
-
168
-
169
-
170
-
171
-
172
-
173
-
174
-
175
-
176
-
177
-
178
-
179
-
180
-
181
-
182
-
183
-
184
-
185
-
186
-
187
-
188
-
189
-
190
-
191
-
192
-
193
-
194
-
195
-
196
-
197
-
198
-
199
-
200
-
201
-
202
-
203
-
204
-
205
-
206
-
207
-
208
-
209
-
210
-
211
-
212
-
213
 |
 |

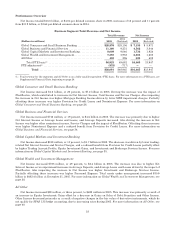
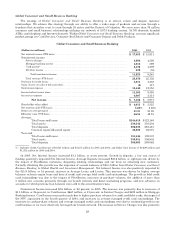
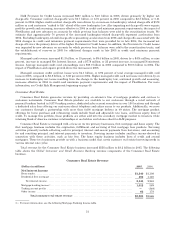
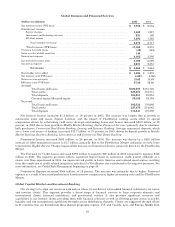
Global Consumer and Small Business Banking
The strategy of Global Consumer and Small Business Banking is to attract, retain and deepen customer
relationships. We achieve this strategy through our ability to offer a wide range of products and services through a
franchise that stretches coast to coast through 29 states and the District of Columbia. We serve more than 38 million
consumer and small business relationships utilizing our network of 5,873 banking centers, 16,785 domestic branded
ATMs, and telephone and Internet channels. Within Global Consumer and Small Business Banking, our most significant
product groups are Card Services, Consumer Real Estate and Consumer Deposit and Debit Products.
Global Consumer and Small Business Banking
(Dollars in millions) 2005 2004
Net interest income (FTE basis) ........................................................... $ 17,053 $ 15,911
Noninterest income:
Servicecharges...................................................................... 4,996 4,329
Mortgage banking income ............................................................ 1,012 589
Card income(1) ....................................................................... 5,476 4,359
Allotherincome ..................................................................... 339 (32)
Total noninterest income ......................................................... 11,823 9,245
Total revenue (FTE basis) ............................................................ 28,876 25,156
Provision for credit losses ................................................................. 4,271 3,333
Gains (losses) on sales of debt securities .................................................... (2) 117
Noninterest expense ..................................................................... 13,440 12,555
Income before income taxes ............................................................... 11,163 9,385
Income tax expense ...................................................................... 4,007 3,414
Net income .......................................................... $ 7,156 $ 5,971
Shareholder value added ................................................................. $ 4,013 $ 3,325
Net interest yield (FTE basis) ............................................................. 5.63% 5.46%
Return on average equity ................................................................. 21.31 21.28
Efficiency ratio (FTE basis) ............................................................... 46.54 49.91
Average:
Totalloansandleases .................................................. $144,019 $122,148
Total assets ........................................................... 330,342 316,204
Total deposits ......................................................... 306,038 283,481
Common equity/Allocated equity ......................................... 33,589 28,057
Year end:
Totalloansandleases .................................................. 151,646 139,507
Total assets ........................................................... 335,551 336,902
Total deposits ......................................................... 306,083 299,062
(1) Includes Credit Card Income of $3,847 million and $3,127 million for 2005 and 2004, and Debit Card Income of $1,629 million and
$1,232 million for 2005 and 2004.
In 2005, Net Interest Income increased $1.1 billion, or seven percent. Growth in deposits, a low cost source of
funding, positively impacted Net Interest Income. Average Deposits increased $22.6 billion, or eight percent, driven by
the impact of FleetBoston customers, deepening existing relationships and our focus on attracting new customers.
Partially offsetting this growth was the migration of account balances of $28.1 billion from Global Consumer and Small
Business Banking to Global Wealth and Investment Management. Net Interest Income was also positively impacted by
the $21.9 billion, or 18 percent, increase in Average Loans and Leases. This increase was driven by higher average
balances on home equity loans and lines of credit and average held credit card outstandings. The growth in held credit
card outstandings was due to the impact of FleetBoston, increases in purchase volumes, the addition of more than
5 million new accounts primarily through our branch network and direct marketing programs, and new advances on
accounts for which previous loan balances were sold to the securitization trusts.
Noninterest Income increased $2.6 billion, or 28 percent, in 2005. The increase was primarily due to increases of
$1.1 billion, or 26 percent, in Card Income, $667 million, or 15 percent, in Service Charges and $423 million in Mortgage
Banking Income. Card Income increased mainly due to higher purchase volumes for credit and debit cards, the impact of
the NPC acquisition in the fourth quarter of 2004, and increases in average managed credit card outstandings. The
increases in card purchase volumes and average managed credit card outstandings were due to continued growth in our
card business as we more effectively leveraged our branch network. The increase in Service Charges was due primarily
28