Bank of America 2005 Annual Report Download - page 106
Download and view the complete annual report
Please find page 106 of the 2005 Bank of America annual report below. You can navigate through the pages in the report by either clicking on the pages listed below, or by using the keyword search tool below to find specific information within the annual report.-
 1
1 -
2
-
3
-
4
-
5
-
6
-
7
-
8
-
9
-
10
-
11
-
12
-
13
-
14
-
15
-
16
-
17
-
18
-
19
-
20
-
21
-
22
-
23
-
24
-
25
-
26
-
27
-
28
-
29
-
30
-
31
-
32
-
33
-
34
-
35
-
36
-
37
-
38
-
39
-
40
-
41
-
42
-
43
-
44
-
45
-
46
-
47
-
48
-
49
-
50
-
51
-
52
-
53
-
54
-
55
-
56
-
57
-
58
-
59
-
60
-
61
-
62
-
63
-
64
-
65
-
66
-
67
-
68
-
69
-
70
-
71
-
72
-
73
-
74
-
75
-
76
-
77
-
78
-
79
-
80
-
81
-
82
-
83
-
84
-
85
-
86
-
87
-
88
-
89
-
90
-
91
-
92
-
93
-
94
-
95
-
 96
96 -
 97
97 -
 98
98 -
 99
99 -
 100
100 -
 101
101 -
 102
102 -
 103
103 -
 104
104 -
 105
105 -
 106
106 -
 107
107 -
 108
108 -
 109
109 -
 110
110 -
 111
111 -
 112
112 -
 113
113 -
 114
114 -
 115
115 -
 116
116 -
117
-
118
-
119
-
120
-
121
-
122
-
123
-
124
-
125
-
126
-
127
-
128
-
129
-
130
-
131
-
132
-
133
-
134
-
135
-
136
-
137
-
138
-
139
-
140
-
141
-
142
-
143
-
144
-
145
-
146
-
147
-
148
-
149
-
150
-
151
-
152
-
153
-
154
-
155
-
156
-
157
-
158
-
159
-
160
-
161
-
162
-
163
-
164
-
165
-
166
-
167
-
168
-
169
-
170
-
171
-
172
-
173
-
174
-
175
-
176
-
177
-
178
-
179
-
180
-
181
-
182
-
183
-
184
-
185
-
186
-
187
-
188
-
189
-
190
-
191
-
192
-
193
-
194
-
195
-
196
-
197
-
198
-
199
-
200
-
201
-
202
-
203
-
204
-
205
-
206
-
207
-
208
-
209
-
210
-
211
-
212
-
213
 |
 |

We prepare forward looking forecasts of Net Interest Income. These baseline forecasts take into consideration
expected future business growth, ALM positioning, and the direction of interest rate movements as implied by the
markets’ forward interest rate curve. We then measure and evaluate the impact that alternative interest rate scenarios
have to these static baseline forecasts in order to assess interest rate sensitivity under varied conditions. The spot and
12-month forward rates used in our respective baseline forecasts at December 31, 2005 and 2004 were as follows:
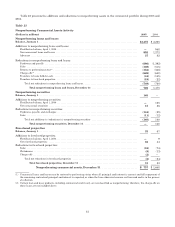
Table 27
Forward Rates
December 31
2005 2004
Federal
Funds
Ten-Year
Constant
Maturity Swap Federal
Funds
Ten-Year
Constant
Maturity Swap
Spotrates .................................. 4.25% 4.94% 2.25% 4.64%
12-monthforwardrates ...................... 4.75 4.97 3.25 4.91
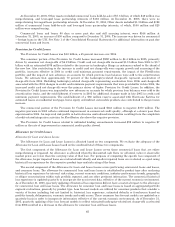
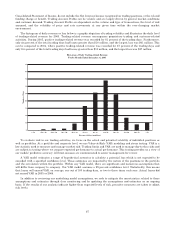
The following table reflects the pre-tax dollar impact to forecasted Core Net Interest Income over the next twelve
months from December 31, 2005 and 2004, resulting from a 100 bp gradual parallel increase, a 100 bp gradual parallel
decrease, a 100 bp gradual curve flattening (increase in short-term rates) and a 100 bp gradual curve steepening
(increase in long-tem rates) from the forward curve.
Table 28
Estimated Net Interest Income at Risk
(Dollars in millions) December 31
Curve Change Short
Rate Long
Rate 2005 2004
(Restated)
+100 Parallel shift .......................................... +100 +100 $(357) $(183)
-100Parallelshift .......................................... -100 -100 244 (126)
Flatteners
Shortend.............................................. +100 — (523) (462)
Longend .............................................. — -100 (298) (677)
Steepeners
Shortend.............................................. -100 — 536 497
Longend .............................................. — +100 168 97
The sensitivity analysis above assumes that we take no action in response to these rate shifts over the indicated
years.
Beyond what is already implied in the forward curve, we are modestly exposed to rising rates primarily due to
increased funding costs. Conversely, we would benefit from falling rates or a steepening of the yield curve beyond what is
already implied in the forward curve.
As part of the ALM process, we use securities, residential mortgages, and interest rate and foreign exchange
derivatives in managing interest rate sensitivity.
Securities
The securities portfolio is integral to our ALM process. The decision to purchase or sell securities is based upon the
current assessment of economic and financial conditions, including the interest rate environment, liquidity and
regulatory requirements, and the relative mix of our cash and derivative positions. During 2005, we purchased securities
of $204.5 billion, sold $134.5 billion, and received paydowns of $37.7 billion. During 2004, we purchased securities of
$243.6 billion, sold $117.7 billion, and received paydowns of $31.8 billion. During the year, we continuously monitored
our interest rate risk position and effected changes in the securities portfolio in order to manage prepayment risk and
interest rate risk. Through sales in the securities portfolio, we realized $1.1 billion in Gains on Sales of Debt Securities
during 2005 and $1.7 billion during 2004. The decrease was primarily due to lower gains realized on mortgage-backed
securities and corporate bonds.
Residential Mortgage Portfolio
During 2005, we purchased $32.0 billion of residential mortgages related to the ALM process. We had whole
mortgage loan sales of $10.1 billion during 2005. During 2004, we purchased $65.9 billion of residential mortgages
related to the ALM process and had minimal sales of whole mortgage loans. Additionally, we received paydowns of $35.8
billion and $44.4 billion for 2005 and 2004. Through sales of whole mortgage loans, we recognized gains that were
recorded as Other Income of $45 million for 2005, compared to losses of $2 million in 2004.
70