Bank of America 2005 Annual Report Download - page 81
Download and view the complete annual report
Please find page 81 of the 2005 Bank of America annual report below. You can navigate through the pages in the report by either clicking on the pages listed below, or by using the keyword search tool below to find specific information within the annual report.-
 1
1 -
2
-
3
-
4
-
5
-
6
-
7
-
8
-
9
-
10
-
11
-
12
-
13
-
14
-
15
-
16
-
17
-
18
-
19
-
20
-
21
-
22
-
23
-
24
-
25
-
26
-
27
-
28
-
29
-
30
-
31
-
32
-
33
-
34
-
35
-
36
-
37
-
38
-
39
-
40
-
41
-
42
-
43
-
44
-
45
-
46
-
47
-
48
-
49
-
50
-
51
-
52
-
53
-
54
-
55
-
56
-
57
-
58
-
59
-
60
-
61
-
62
-
63
-
64
-
65
-
66
-
67
-
68
-
69
-
70
-
 71
71 -
 72
72 -
 73
73 -
 74
74 -
 75
75 -
 76
76 -
 77
77 -
 78
78 -
 79
79 -
 80
80 -
 81
81 -
 82
82 -
 83
83 -
 84
84 -
 85
85 -
 86
86 -
 87
87 -
 88
88 -
 89
89 -
 90
90 -
 91
91 -
92
-
93
-
94
-
95
-
96
-
97
-
98
-
99
-
100
-
101
-
102
-
103
-
104
-
105
-
106
-
107
-
108
-
109
-
110
-
111
-
112
-
113
-
114
-
115
-
116
-
117
-
118
-
119
-
120
-
121
-
122
-
123
-
124
-
125
-
126
-
127
-
128
-
129
-
130
-
131
-
132
-
133
-
134
-
135
-
136
-
137
-
138
-
139
-
140
-
141
-
142
-
143
-
144
-
145
-
146
-
147
-
148
-
149
-
150
-
151
-
152
-
153
-
154
-
155
-
156
-
157
-
158
-
159
-
160
-
161
-
162
-
163
-
164
-
165
-
166
-
167
-
168
-
169
-
170
-
171
-
172
-
173
-
174
-
175
-
176
-
177
-
178
-
179
-
180
-
181
-
182
-
183
-
184
-
185
-
186
-
187
-
188
-
189
-
190
-
191
-
192
-
193
-
194
-
195
-
196
-
197
-
198
-
199
-
200
-
201
-
202
-
203
-
204
-
205
-
206
-
207
-
208
-
209
-
210
-
211
-
212
-
213
 |
 |

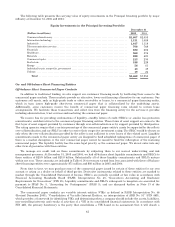
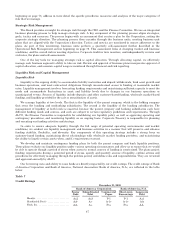
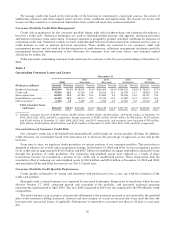
The following table summarizes the total unfunded, or off-balance sheet, credit extension commitment amounts by
expiration date. At December 31, 2005, charge cards (nonrevolving card lines) to individuals and government entities
guaranteed by the U.S. government in the amount of $9.4 billion (related outstandings of $171 million) were not
included in credit card line commitments in the table below.
Table 6
Credit Extension Commitments
December 31, 2005
(Dollars in millions)
Expires
in 1
year
or less
Expires
after 1
year
through
3 years
Expires
after 3
years
through
5 years
Expires
after 5
years Total
Loan commitments(1) ................................................. $112,829 $55,840 $80,748 $ 28,340 $277,757
Homeequitylinesofcredit ........................................... 1,317 714 1,673 74,922 78,626
Standby letters of credit and financial guarantees ....................... 22,320 8,661 5,361 6,753 43,095
Commercial letters of credit .......................................... 4,627 29 17 481 5,154
Legallybindingcommitments ..................................... 141,093 65,244 87,799 110,496 404,632
Creditcardlines .................................................... 180,694 12,274 — — 192,968
Total ...................................................... $321,787 $77,518 $87,799 $110,496 $597,600
(1) At December 31, 2005, there were equity commitments of $1.4 billion related to obligations to further fund Principal Investing
equity investments.
Managing Risk
Overview
Our management governance structure enables us to manage all major aspects of our business through an
integrated planning and review process that includes strategic, financial, associate, customer and risk planning. We
derive much of our revenue from managing risk from customer transactions for profit. In addition to qualitative factors,
we utilize quantitative measures to optimize risk and reward trade offs in order to achieve growth targets and financial
objectives while reducing the variability of earnings and minimizing unexpected losses. Risk metrics that allow us to
measure performance include economic capital targets, SVA targets and corporate risk limits. By allocating capital to a
business unit, we effectively define that unit’s ability to take on risk. Country, trading, asset allocation and other limits
supplement the allocation of economic capital. These limits are based on an analysis of risk and reward in each business
unit and management is responsible for tracking and reporting performance measurements as well as any exceptions to
guidelines or limits. Our risk management process continually evaluates risk and appropriate metrics needed to
measure it. Our business exposes us to the following major risks: strategic, liquidity, credit, market and operational.
Strategic Risk is the risk that adverse business decisions, ineffective or inappropriate business plans or failure to
respond to changes in the competitive environment, business cycles, customer preferences, product obsolescence,
execution and/or other intrinsic risks of business will impact our ability to meet our objectives. Liquidity risk is the
inability to accommodate liability maturities and deposit withdrawals, fund asset growth and meet contractual
obligations through unconstrained access to funding at reasonable market rates. Credit risk is the risk of loss arising
from a borrower’s or counterparty’s inability to meet its obligations. Market risk is the risk that values of assets and
liabilities or revenues will be adversely affected by changes in market conditions, such as interest rate movements.
Operational risk is the risk of loss resulting from inadequate or failed internal processes, people and systems or external
events.
Risk Management Processes and Methods
We have established control processes and use various methods to align risk-taking and risk management
throughout our organization. These control processes and methods are designed around “three lines of defense”: lines of
business; support units (including Risk Management, Compliance, Finance, Human Resources and Legal); and
Corporate Audit.
Management is responsible for identifying, quantifying, mitigating and managing all risks within their lines of
business, while certain enterprise-wide risks are managed centrally. For example, except for trading-related business
activities, interest rate risk associated with our business activities is managed in the Corporate Treasury and Corporate
Investment functions. Line of business management makes and executes the business plan and is closest to the changing
nature of risks and, therefore, we believe is best able to take actions to manage and mitigate those risks. Our lines of
business prepare quarterly self-assessment reports to identify the status of risk issues, including mitigation plans, if
45