Bank of America 2005 Annual Report Download - page 49
Download and view the complete annual report
Please find page 49 of the 2005 Bank of America annual report below. You can navigate through the pages in the report by either clicking on the pages listed below, or by using the keyword search tool below to find specific information within the annual report.-
 1
1 -
2
-
3
-
4
-
5
-
6
-
7
-
8
-
9
-
10
-
11
-
12
-
13
-
14
-
15
-
16
-
17
-
18
-
19
-
20
-
21
-
22
-
23
-
24
-
25
-
26
-
27
-
28
-
29
-
30
-
31
-
32
-
33
-
34
-
35
-
36
-
37
-
38
-
 39
39 -
 40
40 -
 41
41 -
 42
42 -
 43
43 -
 44
44 -
 45
45 -
 46
46 -
 47
47 -
 48
48 -
 49
49 -
 50
50 -
 51
51 -
 52
52 -
 53
53 -
 54
54 -
 55
55 -
 56
56 -
 57
57 -
 58
58 -
 59
59 -
60
-
61
-
62
-
63
-
64
-
65
-
66
-
67
-
68
-
69
-
70
-
71
-
72
-
73
-
74
-
75
-
76
-
77
-
78
-
79
-
80
-
81
-
82
-
83
-
84
-
85
-
86
-
87
-
88
-
89
-
90
-
91
-
92
-
93
-
94
-
95
-
96
-
97
-
98
-
99
-
100
-
101
-
102
-
103
-
104
-
105
-
106
-
107
-
108
-
109
-
110
-
111
-
112
-
113
-
114
-
115
-
116
-
117
-
118
-
119
-
120
-
121
-
122
-
123
-
124
-
125
-
126
-
127
-
128
-
129
-
130
-
131
-
132
-
133
-
134
-
135
-
136
-
137
-
138
-
139
-
140
-
141
-
142
-
143
-
144
-
145
-
146
-
147
-
148
-
149
-
150
-
151
-
152
-
153
-
154
-
155
-
156
-
157
-
158
-
159
-
160
-
161
-
162
-
163
-
164
-
165
-
166
-
167
-
168
-
169
-
170
-
171
-
172
-
173
-
174
-
175
-
176
-
177
-
178
-
179
-
180
-
181
-
182
-
183
-
184
-
185
-
186
-
187
-
188
-
189
-
190
-
191
-
192
-
193
-
194
-
195
-
196
-
197
-
198
-
199
-
200
-
201
-
202
-
203
-
204
-
205
-
206
-
207
-
208
-
209
-
210
-
211
-
212
-
213
 |
 |

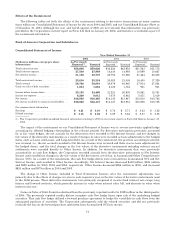
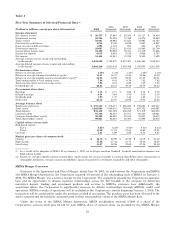
The following tables set forth the effect of the adjustments described above on Net Income for the years ended
December 31, 2005, 2004, 2003, 2002 and 2001 and for the quarterly periods in 2005 and 2004. Although the year and
fourth quarter of 2005 are not restated, this information was previously provided in the Corporation’s current report on
Form 8-K filed on January 23, 2006, and therefore, is included as part of the restatement information.
Increase (Decrease) in Net Income(1)
Year Ended December 31
(Dollars in millions) 2005(2) 2004 2003 2002 2001
As Previously Reported Net income ................................... $16,886 $14,143 $10,810 $9,249 $6,792
Internal fair value hedges ........................................... (271) (190) (144) 406 226
Internal cash flow hedges ............................................ 25 (281) 104 (176) 424
Other,net ......................................................... (175) 275 (9) 74 57
Totaladjustment ............................................... (421) (196) (49) 304 707
RestatedNetincome ................................................ $16,465 $13,947 $10,762 $9,553 $7,499
Percent change ..................................................... (2.5)% (1.4)% (0.5)% 3.3% 10.4%
(1) For presentation purposes, certain numbers have been rounded.
(2) The Corporation provided unaudited financial information relating to 2005 in its current report on Form 8-K filed on January 23,
2006.
Increase (Decrease) in Quarterly Net Income(1, 2)
2005 2004
(Dollars in millions) Fourth(3) Third Second First Fourth Third Second First
As Previously Reported Net income ........... $3,768 $4,127 $4,296 $4,695 $3,849 $3,764 $3,849 $2,681
Internal fair value hedges ................... (74) (148) 130 (179) (76) 157 (435) 164
Internal cash flow hedges ................... (43) (29) 125 (28) 18 (111) 146 (334)
Other,net................................. (77) (108) 106 (95) 65 293 (219) 137
Totaladjustment....................... (194) (285) 361 (302) 7 339 (508) (33)
RestatedNetincome ....................... $3,574 $3,841 $4,657 $4,393 $3,855 $4,103 $3,341 $2,648
Percent change ............................ (5.1)% (6.9)% 8.4% (6.4)% 0.2% 9.0% (13.2)% (1.2)%
(1) See Note 23 of the Consolidated Financial Statements for Restatement of Quarterly Financial Statements (unaudited).
(2) For presentation purposes, certain numbers have been rounded.
(3) The Corporation provided unaudited financial information relating to the fourth quarter of 2005 in its current report on Form 8-K
filed on January 23, 2006.
During the first quarter of 2006, the Corporation terminated certain derivatives used as economic hedges as part of
the ALM process that did not qualify for SFAS 133 hedge accounting and entered into new derivative contracts to hedge
certain of its exposures to changes in interest rates and foreign currency rates. These new contracts are designated in
hedging relationships and meet the requirement for SFAS 133 hedge accounting. Prior to the termination of the
economic hedges noted above, the changes in fair value of such contracts were recorded in Other Income and had a direct
impact on Net Income. As a result, we estimate that Net Income will be reduced by approximately $0.03 per share in the
first quarter of 2006.
13