Bank of America 2005 Annual Report Download - page 111
Download and view the complete annual report
Please find page 111 of the 2005 Bank of America annual report below. You can navigate through the pages in the report by either clicking on the pages listed below, or by using the keyword search tool below to find specific information within the annual report.-
 1
1 -
2
-
3
-
4
-
5
-
6
-
7
-
8
-
9
-
10
-
11
-
12
-
13
-
14
-
15
-
16
-
17
-
18
-
19
-
20
-
21
-
22
-
23
-
24
-
25
-
26
-
27
-
28
-
29
-
30
-
31
-
32
-
33
-
34
-
35
-
36
-
37
-
38
-
39
-
40
-
41
-
42
-
43
-
44
-
45
-
46
-
47
-
48
-
49
-
50
-
51
-
52
-
53
-
54
-
55
-
56
-
57
-
58
-
59
-
60
-
61
-
62
-
63
-
64
-
65
-
66
-
67
-
68
-
69
-
70
-
71
-
72
-
73
-
74
-
75
-
76
-
77
-
78
-
79
-
80
-
81
-
82
-
83
-
84
-
85
-
86
-
87
-
88
-
89
-
90
-
91
-
92
-
93
-
94
-
95
-
96
-
97
-
98
-
99
-
100
-
 101
101 -
 102
102 -
 103
103 -
 104
104 -
 105
105 -
 106
106 -
 107
107 -
 108
108 -
 109
109 -
 110
110 -
 111
111 -
 112
112 -
 113
113 -
 114
114 -
 115
115 -
 116
116 -
 117
117 -
 118
118 -
 119
119 -
 120
120 -
 121
121 -
122
-
123
-
124
-
125
-
126
-
127
-
128
-
129
-
130
-
131
-
132
-
133
-
134
-
135
-
136
-
137
-
138
-
139
-
140
-
141
-
142
-
143
-
144
-
145
-
146
-
147
-
148
-
149
-
150
-
151
-
152
-
153
-
154
-
155
-
156
-
157
-
158
-
159
-
160
-
161
-
162
-
163
-
164
-
165
-
166
-
167
-
168
-
169
-
170
-
171
-
172
-
173
-
174
-
175
-
176
-
177
-
178
-
179
-
180
-
181
-
182
-
183
-
184
-
185
-
186
-
187
-
188
-
189
-
190
-
191
-
192
-
193
-
194
-
195
-
196
-
197
-
198
-
199
-
200
-
201
-
202
-
203
-
204
-
205
-
206
-
207
-
208
-
209
-
210
-
211
-
212
-
213
 |
 |
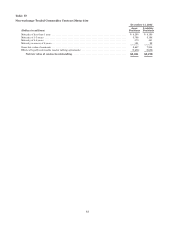
Our Allowance for Loan and Lease Losses is sensitive to the risk rating assigned to commercial loans and leases and
to the loss rates used for the consumer and commercial portfolios. Assuming a downgrade of one level in the internal risk
rating for commercial loans and leases, except loans already risk rated Doubtful as defined by regulatory authorities, the
Allowance for Loan and Lease Losses for the commercial portfolio would increase by approximately $894 million at
December 31, 2005. The Allowance for Loan and Lease Losses as a percentage of loan and lease outstandings at
December 31, 2005 was 1.40 percent and this hypothetical increase in the allowance would raise the ratio to
approximately 1.56 percent. A 10 percent increase in the loss rates used on the consumer and commercial loan and lease
portfolios would increase the Allowance for Loan and Lease Losses at December 31, 2005 by approximately $348 million,
of which $283 million would relate to consumer and $65 million to commercial.
These sensitivity analyses do not represent management’s expectations of the deterioration in risk ratings or the
increases in loss rates but are provided as hypothetical scenarios to assess the sensitivity of the Allowance for Loan and
Lease Losses to changes in key inputs. We believe the risk ratings and loss severities currently in use are appropriate
and that the probability of a downgrade of one level of the internal credit ratings for commercial loans and leases within
a short period of time is remote.
The process of determining the level of the allowance for credit losses requires a high degree of judgment. It is
possible that others, given the same information, may at any point in time reach different reasonable conclusions.
Fair Value of Financial Instruments
Trading Account Assets and Liabilities are recorded at fair value, which is primarily based on actively traded
markets where prices are based on either direct market quotes or observed transactions. Liquidity is a significant factor
in the determination of the fair value of Trading Account Assets or Liabilities. Market price quotes may not be readily
available for some positions, or positions within a market sector where trading activity has slowed significantly or
ceased. Situations of illiquidity generally are triggered by the market’s perception of credit uncertainty regarding a
single company or a specific market sector. In these instances, fair value is determined based on limited available
market information and other factors, principally from reviewing the issuer’s financial statements and changes in credit
ratings made by one or more rating agencies. At December 31, 2005, $4.9 billion, or four percent, of Trading Account
Assets were fair valued using these alternative approaches. An immaterial amount of Trading Account Liabilities were
fair valued using these alternative approaches at December 31, 2005.
Trading Account Profits, which represent the net amount earned from our trading positions, can be volatile and are
largely driven by general market conditions and customer demand. Trading Account Profits are dependent on the
volume and type of transactions, the level of risk assumed, and the volatility of price and rate movements at any given
time. To evaluate risk in our trading activities, we focus on the actual and potential volatility of individual positions as
well as portfolios. At a portfolio and corporate level, we use trading limits, stress testing and tools such as VAR
modeling, which estimates a potential loss which is not expected to be exceeded with a specified confidence level, to
measure and manage market risk. At December 31, 2005, the amount of our VAR was $61 million based on a 99 percent
confidence level. For more information on VAR, see pages 67 through 69.
The fair values of Derivative Assets and Liabilities include adjustments for market liquidity, counterparty credit
quality, future servicing costs and other deal specific factors, where appropriate. To ensure the prudent application of
estimates and management judgment in determining the fair value of Derivative Assets and Liabilities, various
processes and controls have been adopted, which include: a Model Validation Policy that requires a review and approval
of quantitative models used for deal pricing, financial statement fair value determination and risk quantification; a
Trading Product Valuation Policy that requires verification of all traded product valuations; and a periodic review and
substantiation of daily profit and loss reporting for all traded products. These processes and controls are performed
independently of the business segment.
The fair values of Derivative Assets and Liabilities traded in the over-the-counter market are determined using
quantitative models that require the use of multiple market inputs including interest rates, prices, and indices to
generate continuous yield or pricing curves and volatility factors, which are used to value the position. The
predominance of market inputs are actively quoted and can be validated through external sources, including brokers,
market transactions and third-party pricing services. Estimation risk is greater for derivative asset and liability
positions that are either option-based or have longer maturity dates where observable market inputs are less readily
available or are unobservable, in which case quantitative based extrapolations of rate, price or index scenarios are used
in determining fair values. At December 31, 2005, the fair values of Derivative Assets and Liabilities determined by
these quantitative models were $10.5 billion and $6.4 billion. These amounts reflect the full fair value of the derivatives
and do not isolate the discrete value associated with the subjective valuation variable. Further, they represent four
percent and three percent of Derivative Assets and Liabilities, before the impact of legally enforceable master netting
agreements. For the year ended December 31, 2005, there were no changes to the quantitative models, or uses of such
models, that resulted in a material adjustment to the income statement.
75