Bank of America 2005 Annual Report Download - page 156
Download and view the complete annual report
Please find page 156 of the 2005 Bank of America annual report below. You can navigate through the pages in the report by either clicking on the pages listed below, or by using the keyword search tool below to find specific information within the annual report.-
 1
1 -
2
-
3
-
4
-
5
-
6
-
7
-
8
-
9
-
10
-
11
-
12
-
13
-
14
-
15
-
16
-
17
-
18
-
19
-
20
-
21
-
22
-
23
-
24
-
25
-
26
-
27
-
28
-
29
-
30
-
31
-
32
-
33
-
34
-
35
-
36
-
37
-
38
-
39
-
40
-
41
-
42
-
43
-
44
-
45
-
46
-
47
-
48
-
49
-
50
-
51
-
52
-
53
-
54
-
55
-
56
-
57
-
58
-
59
-
60
-
61
-
62
-
63
-
64
-
65
-
66
-
67
-
68
-
69
-
70
-
71
-
72
-
73
-
74
-
75
-
76
-
77
-
78
-
79
-
80
-
81
-
82
-
83
-
84
-
85
-
86
-
87
-
88
-
89
-
90
-
91
-
92
-
93
-
94
-
95
-
96
-
97
-
98
-
99
-
100
-
101
-
102
-
103
-
104
-
105
-
106
-
107
-
108
-
109
-
110
-
111
-
112
-
113
-
114
-
115
-
116
-
117
-
118
-
119
-
120
-
121
-
122
-
123
-
124
-
125
-
126
-
127
-
128
-
129
-
130
-
131
-
132
-
133
-
134
-
135
-
136
-
137
-
138
-
139
-
140
-
141
-
142
-
143
-
144
-
145
-
 146
146 -
 147
147 -
 148
148 -
 149
149 -
 150
150 -
 151
151 -
 152
152 -
 153
153 -
 154
154 -
 155
155 -
 156
156 -
 157
157 -
 158
158 -
 159
159 -
 160
160 -
 161
161 -
 162
162 -
 163
163 -
 164
164 -
 165
165 -
 166
166 -
167
-
168
-
169
-
170
-
171
-
172
-
173
-
174
-
175
-
176
-
177
-
178
-
179
-
180
-
181
-
182
-
183
-
184
-
185
-
186
-
187
-
188
-
189
-
190
-
191
-
192
-
193
-
194
-
195
-
196
-
197
-
198
-
199
-
200
-
201
-
202
-
203
-
204
-
205
-
206
-
207
-
208
-
209
-
210
-
211
-
212
-
213
 |
 |

BANK OF AMERICA CORPORATION AND SUBSIDIARIES
Notes to Consolidated Financial Statements—(Continued)
Variable Interest Entities
At December 31, 2005, the assets and liabilities of the Corporation’s multi-seller asset-backed commercial paper
conduits that have been consolidated in accordance with FASB Interpretation No. 46 (Revised December 2003),
“Consolidation of Variable Interest Entities, an interpretation of ARB No. 51” were reflected in AFS Securities, Other
Assets, and Commercial Paper and Other Short-term Borrowings in Global Capital Markets and Investment Banking.As
of December 31, 2005 and 2004, the Corporation held $6.6 billion and $7.7 billion of assets in these entities while the
Corporation’s maximum loss exposure associated with these entities including unfunded lending commitments was
approximately $8.0 billion and $9.4 billion. The Corporation also had contractual relationships with other consolidated
VIEs that engage in leasing or lending activities or real estate joint ventures. As of December 31, 2005 and 2004, the
amount of assets of these entities was $750 million and $560 million, and the Corporation’s maximum possible loss
exposure was $212 million and $132 million.
Additionally, the Corporation had significant variable interests in other VIEs that it did not consolidate because it
was not deemed to be the primary beneficiary. In such cases, the Corporation does not absorb the majority of the entities’
expected losses nor does it receive a majority of the entities’ expected residual returns. These entities typically support
the financing needs of the Corporation’s customers by facilitating their access to the commercial paper markets. The
Corporation functions as administrator and provides either liquidity and letters of credit, or derivatives to the VIE. The
Corporation also provides asset management and related services to other special purpose vehicles that engage in
lending, investing, or real estate activities. Total assets of these entities at December 31, 2005 and 2004 were
approximately $32.5 billion and $32.9 billion. Revenues associated with administration, liquidity, letters of credit and
other services were approximately $121 million and $154 million for the year ended December 31, 2005 and 2004. At
December 31, 2005 and 2004, the Corporation’s maximum loss exposure associated with these VIEs was approximately
$26.7 billion and $25.0 billion, which is net of amounts syndicated.
Management does not believe losses resulting from its involvement with the entities discussed above will be
material. See Note 1 of the Consolidated Financial Statements for additional discussion of special purpose financing
entities.
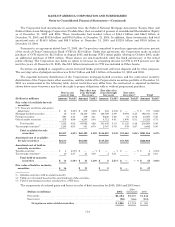
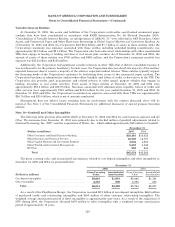
Note 10—Goodwill and Other Intangibles
The following table presents allocated Goodwill at December 31, 2005 and 2004 for each business segment and All
Other. The increases from December 31, 2004 were primarily due to the $65 million of goodwill adjustments related to
National Processing, Inc. (NPC) and the acquisitions of Works, Inc., which added approximately $49 million to Goodwill.
December 31
(Dollars in millions) 2005 2004
Global Consumer and Small Business Banking ....................................... $18,491 $18,453
Global Business and Financial Services ............................................. 16,750 16,707
Global Capital Markets and Investment Banking ..................................... 4,542 4,500
Global Wealth and Investment Management ......................................... 5,333 5,338
AllOther........................................................................ 238 264
Total ....................................................................... $45,354 $45,262
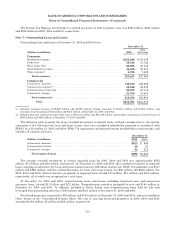
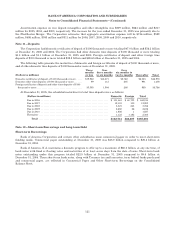
The gross carrying value and accumulated amortization related to core deposit intangibles and other intangibles at
December 31, 2005 and 2004 are presented below:
December 31
2005 2004
(Dollars in millions) Gross Carrying
Value Accumulated
Amortization Gross Carrying
Value Accumulated
Amortization
Core deposit intangibles ................................... $3,661 $1,881 $3,668 $1,354
Other intangibles ......................................... 2,353 939 2,256 683
Total ................................................ $6,014 $2,820 $5,924 $2,037
As a result of the FleetBoston Merger, the Corporation recorded $2.2 billion of core deposit intangibles, $660 million
of purchased credit card relationship intangibles and $409 million of other customer relationship intangibles. The
weighted average amortization period of these intangibles is approximately nine years. As a result of the acquisition of
NPC during 2004, the Corporation allocated $479 million to other intangibles with a weighted average amortization
period of approximately 10 years.
120